Large number of JVM threads

We have Prometheus monitoring looking at Jira instance. Here is jvm_threads_current graph:


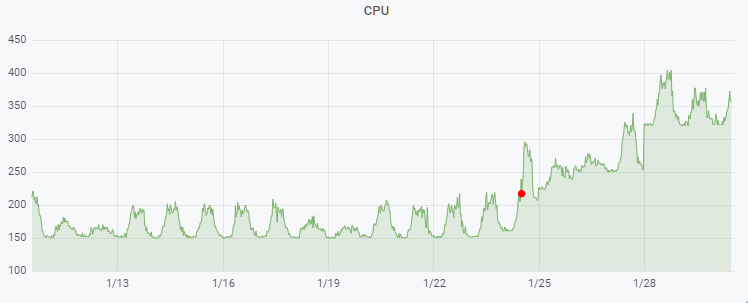
red dot is a moment when eazyBI was installed, configured and first import was made. eazyBI is working in same JVM process. It looks like eazyBI launched and holding ~170 threads. Is this ok?
Another interesting thing is nearly vertical growth of threads count (+70) on “1/28” label on X axis. It is exactly the moment of another data import, not first, though.

Hi Alexey,

It could be that eazyBI creates additional threads during data import and report execution. But it shouldn’t be such a high thread count.
To check the reason why there are so many threads, could you please send Jira process thread dump to our support email support@eazybi.com? Also, please collect and send eazyBI log files (https://docs.eazybi.com/eazybijira/set-up-and-administer/set-up-and-administer-for-jira-server/troubleshooting#Troubleshooting-eazyBIlogfiles).

Best regards,
Janis