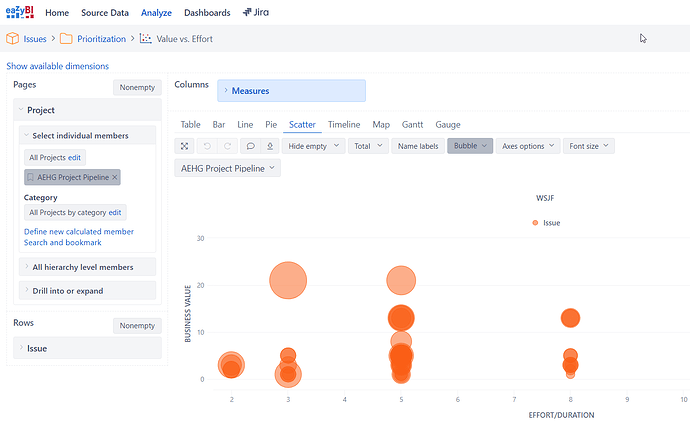
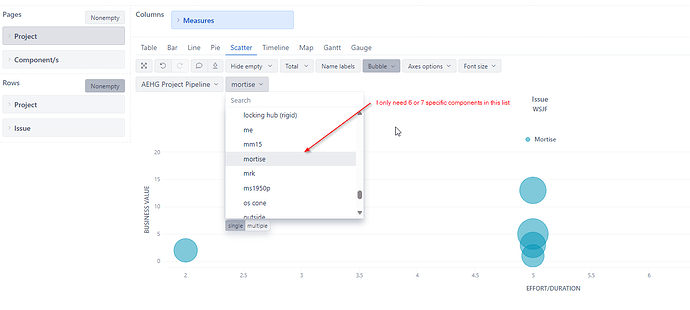
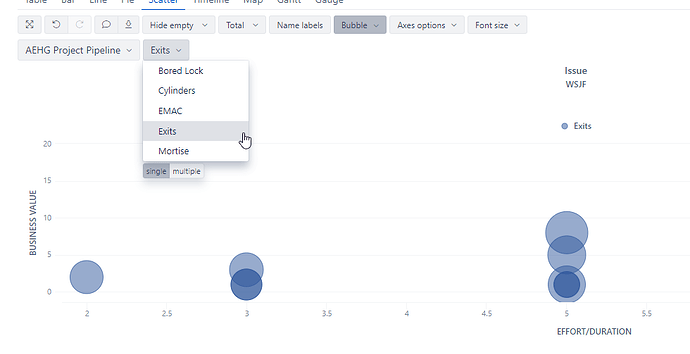
I am trying to build a bubble chart. I am stuck at one point. I created a bookmark to limit the data to one project. Now I want to be able to filter by Component.
My issue is that it is pulling in all of the components from all the projects in the data source. I want to limit the component list to only what is in my selected project.
Or specify the list of components that I want to see.
Hello @wojo3,
Thanks for posting your question!
I suggest the following approach:
-
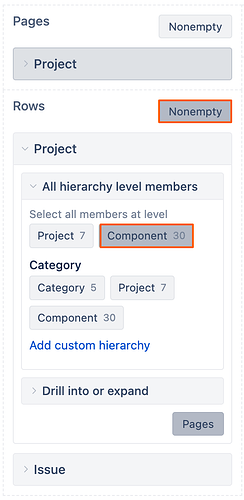
add Project dimension to Rows, select “Component” level member
-
add Project dimension to Pages to filter by a specific Project
If you have “Nonempty” option enabled, you will only get components for the Project you have selected in the Page filter.
Best,
Marita // support@eazybi.com
Hello Marita,
Thank you for replying. Unfortunately, I was not able to get that to work.
For reference, each bubble in the chart is based off of data stored in a Jira Issue (WSJF, Effort, Bus Value). So I believe I need the “Issue” dimension to be in the Row. as that is what the chart is based on.
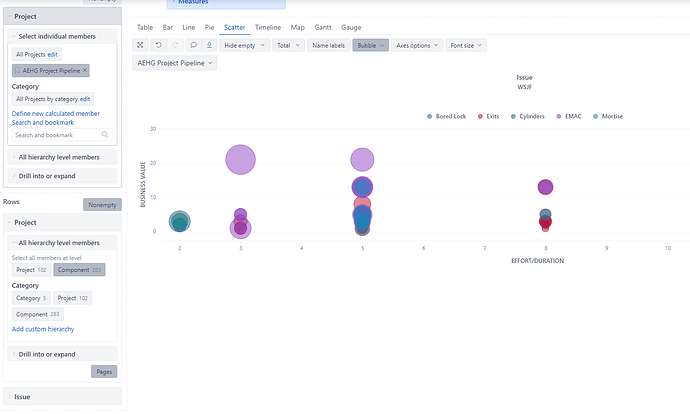
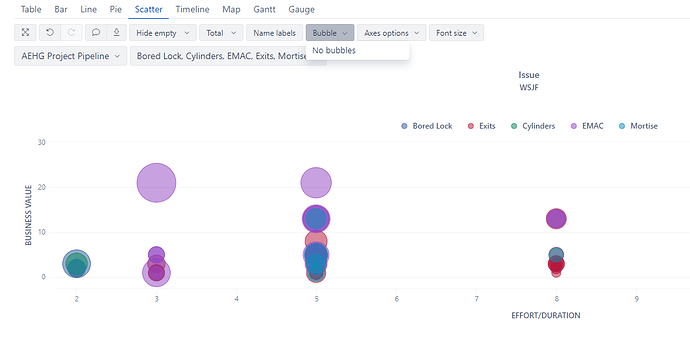
The attached image is what I would like to get to.
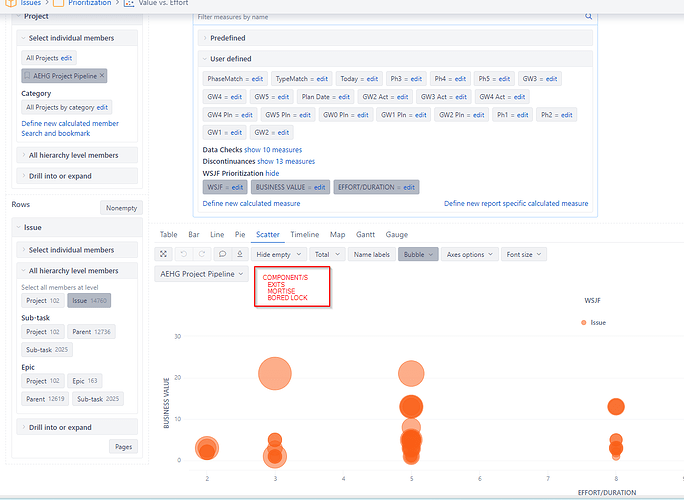
If I add Project to the Rows is gets me a little closer (colors the various bubbles by their components) but I am not able to get it to the point where I can use the dropdowns to filter out by component. If I follow your directions exactly, I get nothing.
Here is the result:
I could create a separate chart for each component but I would really like something like the last chart and then have the user select the component filter.
As an update, I created an account specific calculated field for Component/s: Component (eazybi.com) and places that in the Pages area.
That has gotten it a bit closer. I actually have a dropdown where I can filter by Component…however…it pulls in “ALL” components.
Is it possible to modify the code for the calculated field to limit to a specific project or limit to specific projects with a certain Jira Project Category?
Here is the code:
if (issue.fields.components) {
  var componentlist = [];
  issue.fields.components.forEach(function(component) {
    componentlist.push(component.name.toLowerCase());
  });
  return componentlist.join(",");
}
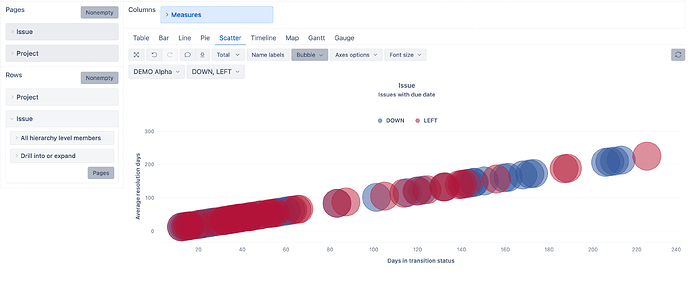
Here is the current state of the report:
Hi @wojo3,
Thanks for the follow up questions & apologies for the delay in response.
Here’s what you can do:
- add Issue dimension to Rows, select “issue” level member
- add Issue dimension to Pages, select “project” level member
- add Project dimension to Rows and Pages, select “component” level member in both
- enable “Nonempty” for both, Rows and Pages
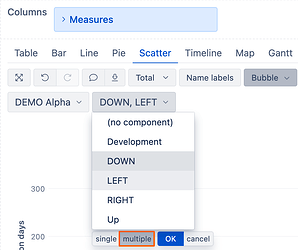
This will create two Page filters allowing your users to filter by Project in the first one & Component in the second one:
Your users can switch to multiple choice selection in the dropdown if they would like to select multiple components in the Page filter:
More about Page filters here: Create reports
Best,
Marita // support@eazybi.com
