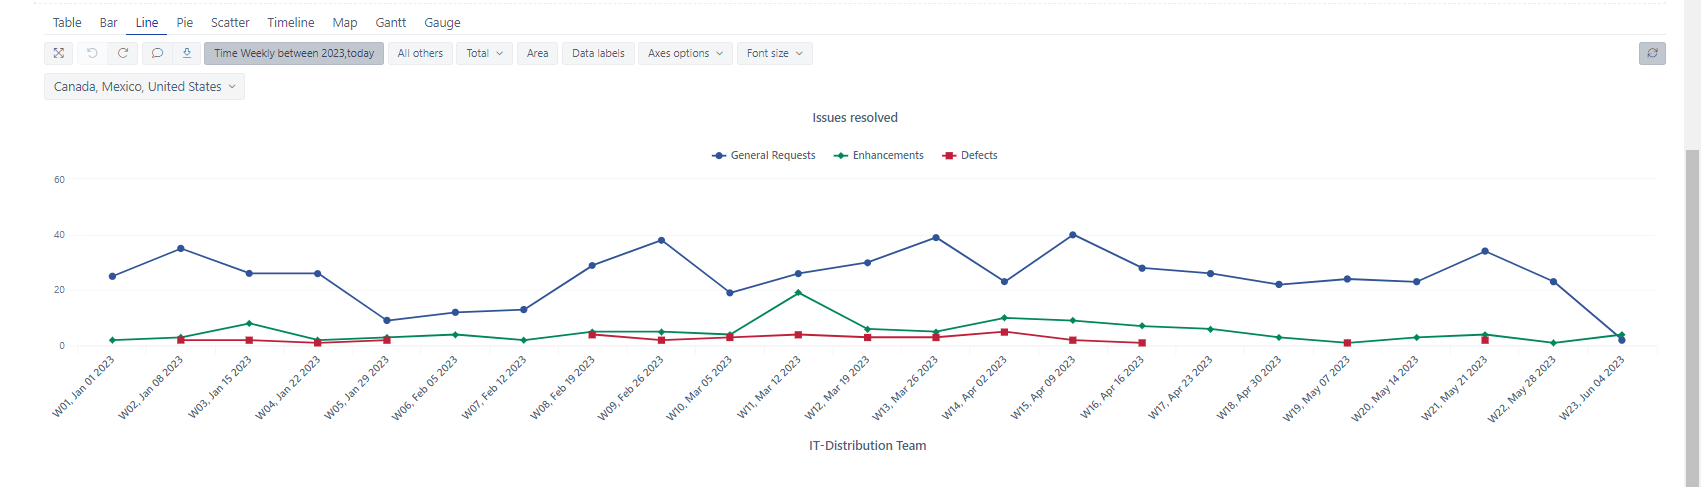
I need my line chart to keep a continuous line even when nothing was resolved. Is there any formulas to keep the line continuous.
1 Like
good suggestion as this will provide a better visual trend
Hello @tfioresi !
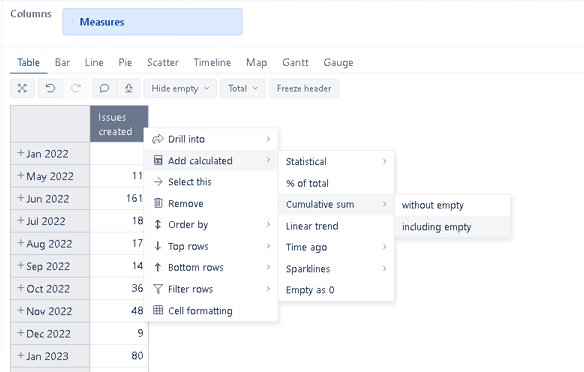
Try “cumulative sum” (click (!) on your column header):
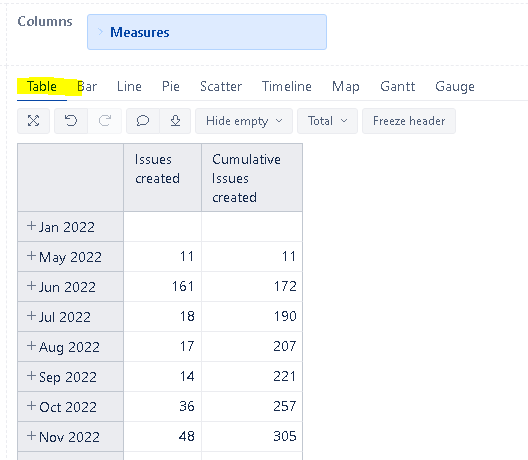
Here is the result in “table” mode:
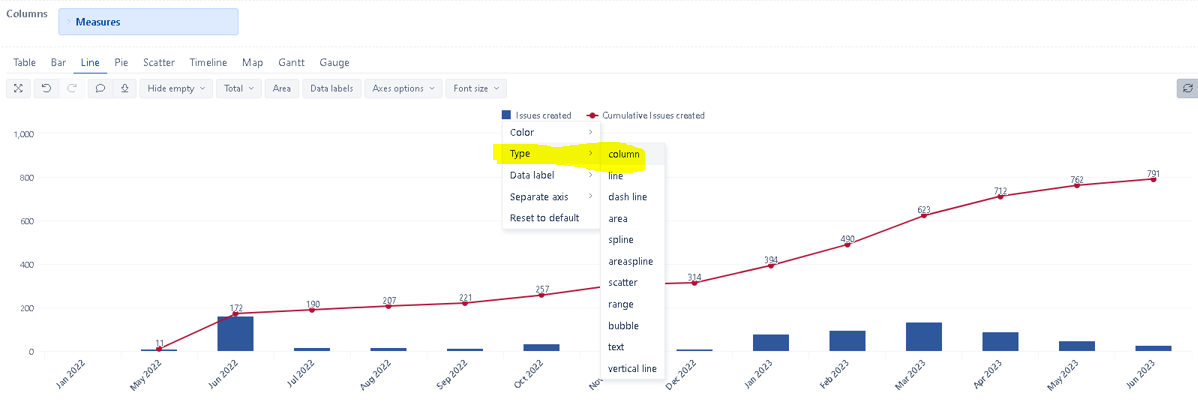
Then switch to “Line” or “timeline”. Keep "issues created rendered as “column” and the “cumulative sum” as “line”:
Hope it helps!
V.
1 Like
Hi @tfioresi
You can also define a new calculated measure in the Measures dimension with the following formula:
CoalesceEmpty([Measures].[Issues resolved],0)
The CoalesceEmpty() function will replace all the empty results with 0.
Cheers!
Nauris
1 Like