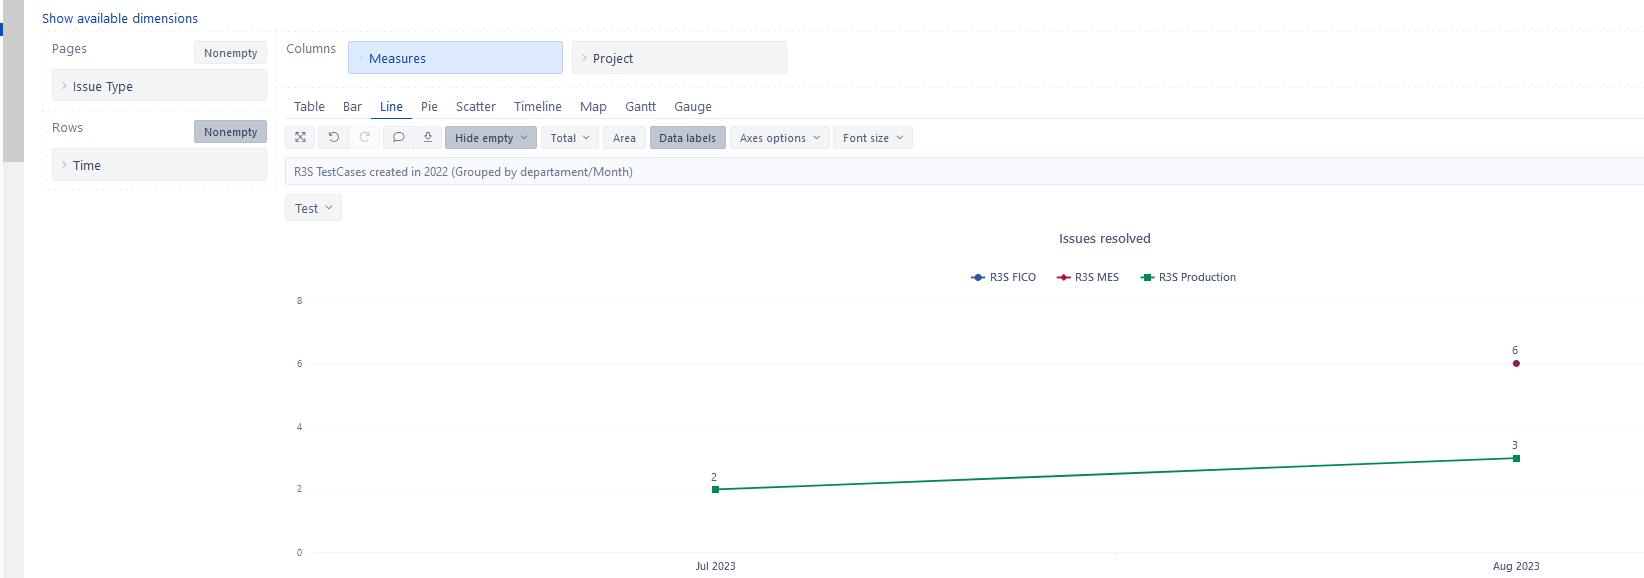
I created linear graph to show how number of resolved Test cases increased over a time (cummulative)
However the problem I have is that values does not starts from zero.
How I can have all this line graphs starting from zero?
I created linear graph to show how number of resolved Test cases increased over a time (cummulative)
However the problem I have is that values does not starts from zero.
How I can have all this line graphs starting from zero?
Hi @Tommi ,
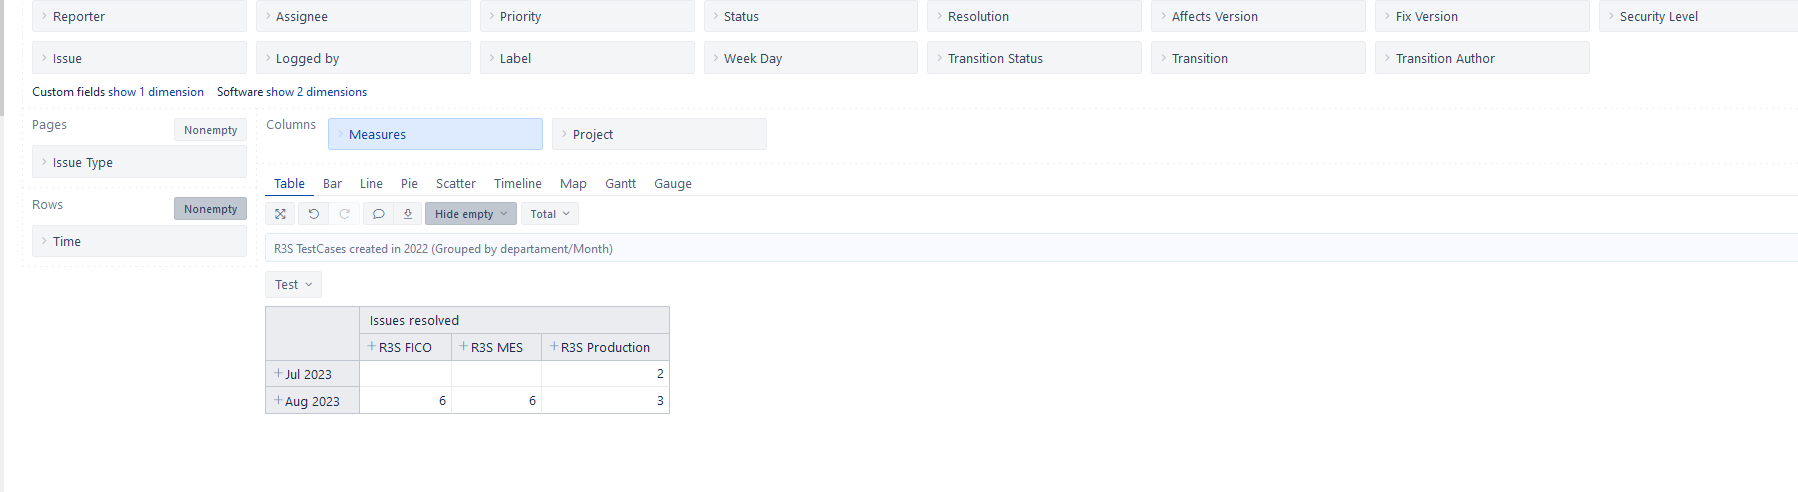
If you wish to display 0 when the values in empty, then you can use the function CoalesceEmpty(), that will replace the first argument (measure) empty values with the second argument.
CoalesceEmpty([Measures].[Issues resolved],0)
Best,
Gerda // support@eazybi.com