Hello,
When I select Linear Trend line, it shows value for date where no data existed.
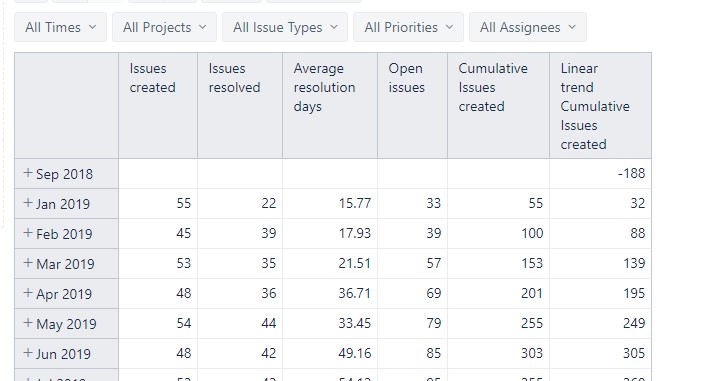
In this report, https://eazybi.com/accounts/1000/cubes/Issues/reports/80614-created-vs-resolved-issues-over-time
the chart shows -188 for Sept 2018. Could someone please explain why this is the case?
Hi @bgeorge,
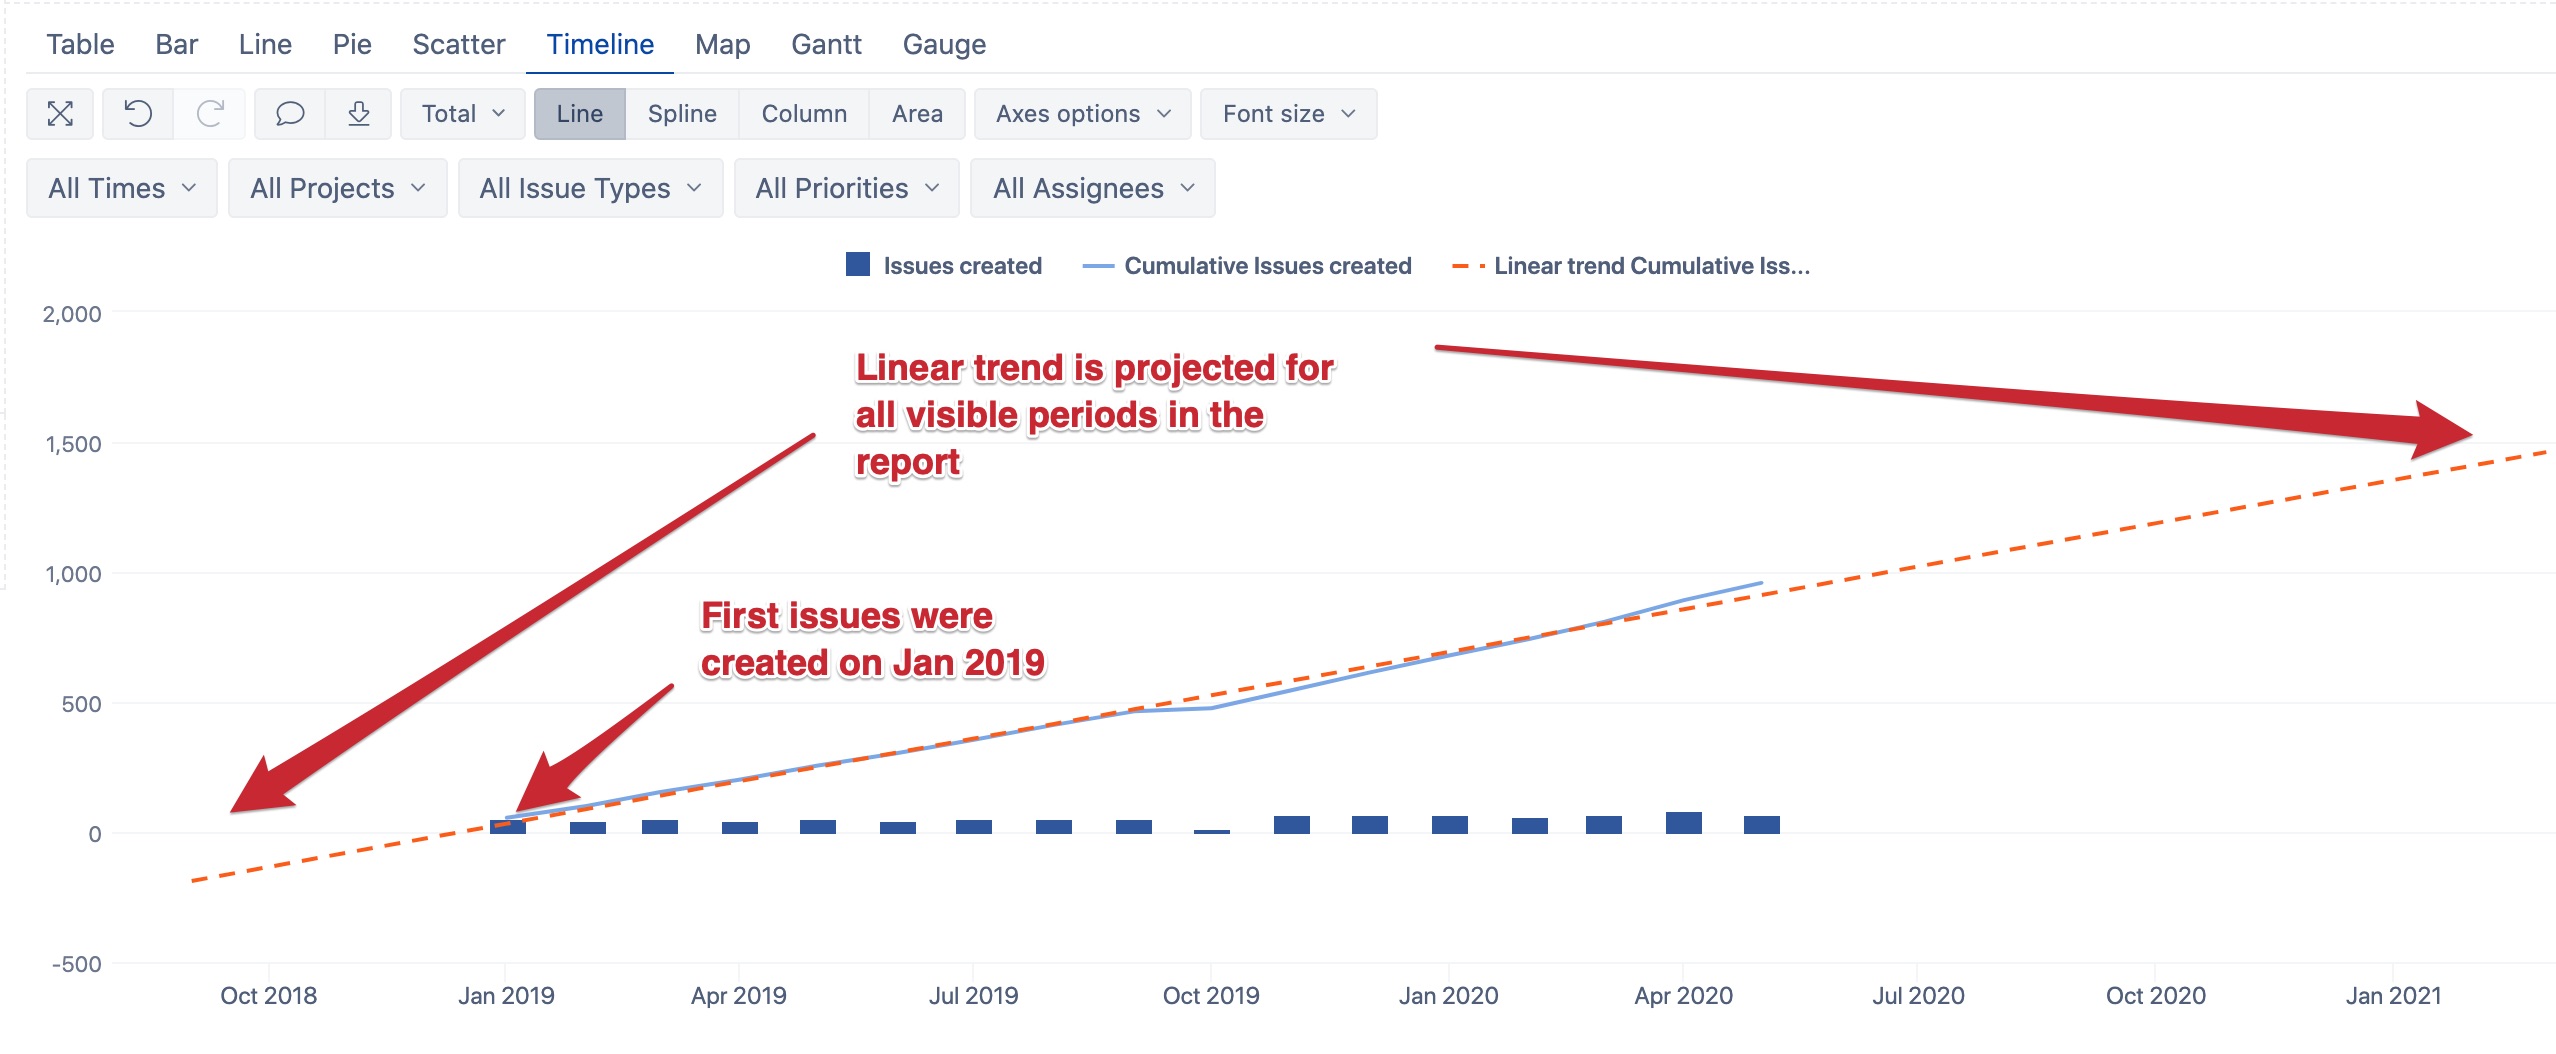
The trend line is a straight line that usually goes up or down. In this case, the line goes slightly up all the time, and if you look on a really old period before data is gathered, then you can also get a negative number that is mathematically calculated but not practically applicable in real life.
in this particular case, the period Sep 2018 is before any issue was created and any data available to calculate the trend line; it is a projection. See the picture below
Usually, a particular period or at least the start date of the period is selected for a report analyzing the trends and guidelines. Another option is to enable Nonempty to see only relevant periods, but this would hide also the future periods with no data yet. I would recommend building trend line reports for a specified period of time. For example, you may use Time on pages as a filter when building reports with trend lines or predictions.
Best,
Zane /support@eazyBI.com