I’m building a report of release tickets to create a scorecard. For any release ticket, we use some Jira field values to determine the type of release and we assign a score, accordingly. For example, releases can be categorised as 'simple’ or ‘complex’ with different scores awarded to each type of release (50 and 25 in the case above)
We use a Jira field, imported as a dimension, to list the particular service to be released and this is added to the report as a row and page item so that we can see the total simple & complex releases and points awarded per service.
E.g
| Simple change | Complex change | Completed Change Points | |
|---|---|---|---|
| Service x | 2 | 1 | 100 |
If we add the issue dimension to rows we can see details of each ticket, the release type and the points awarded. This gives us full transparency on our scoring. So far, so good
To extend this report we also want to add some scores for release related bugs and release related incidents. (These will generate -ve points on the scorecard) We have created issues links dimensions for release related bugs and incidents importing as both properties and dimensions. Our bug tickets contain a number for customer impact and our incidents have severity (1,2 or 3).
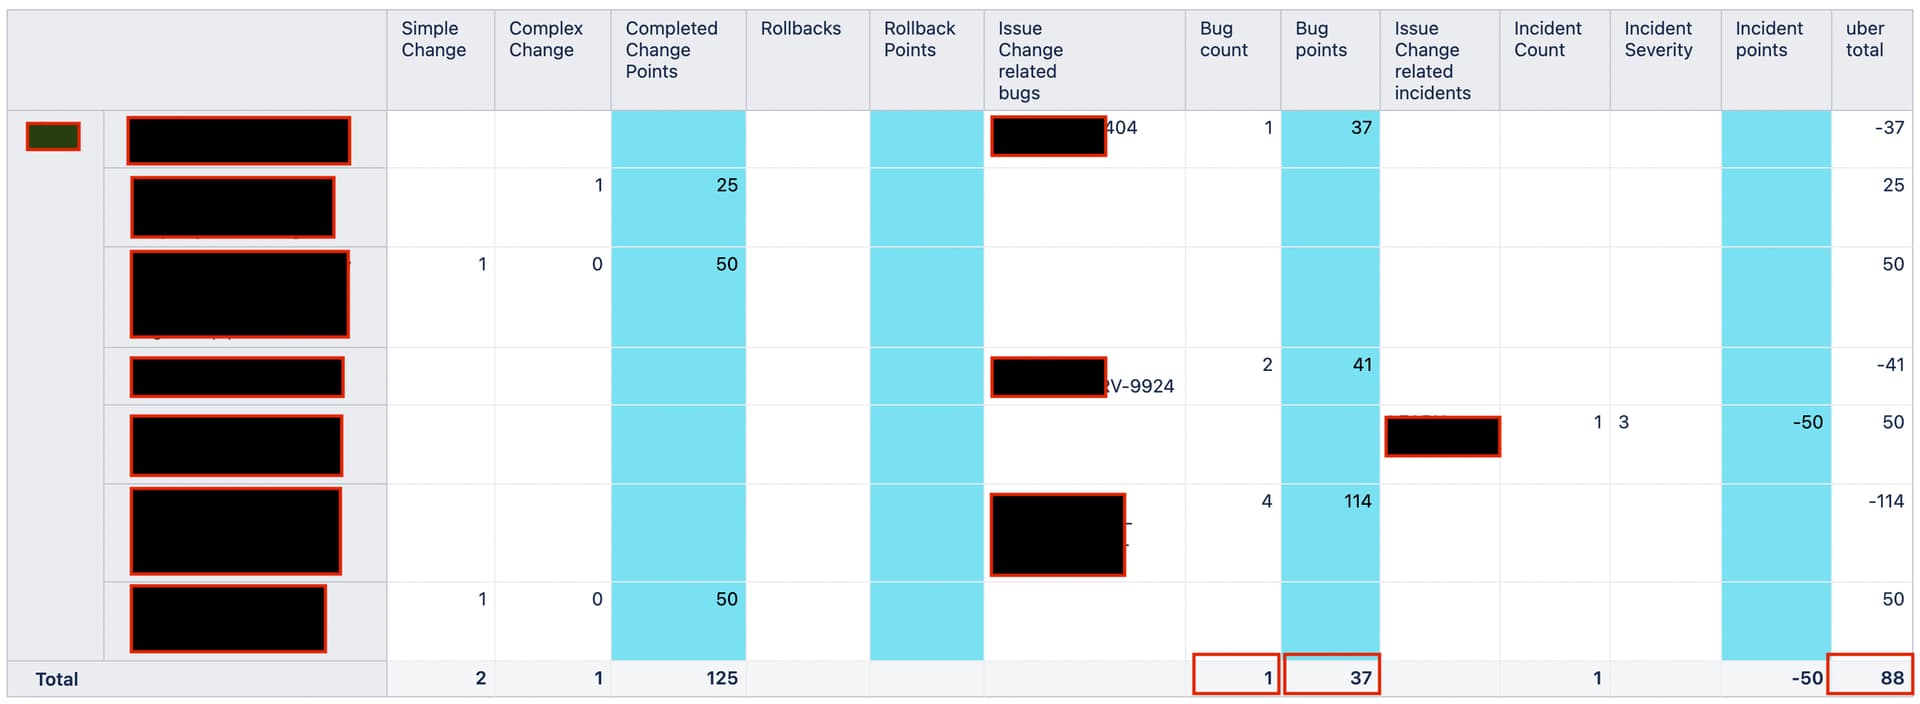
I’m having two problems working with release bugs and incidents (see screenshot below)
For release bugs, both the bug count and sum of customer impact points don’t total correctly on the row total. (Bug count uses a version of the “Linked bug count” formula in the Demo Training ’Stories with Bugs details’ report.) If I have the service dimension only on the report rows, I only see the total of items with a count of 1. If I add issues to the report rows, I can see items with with a count of more than 1 but the total is still just the total of count = 1. (If I also add the release related bugs dimension, the totals row finally reflects the right total)
For incidents, I can’t make the points count work correctly, either. Incident count uses the same approach as bug count (which means it probably fails similarly to bug count) and for incident points I use a simple CASE statement which works with the issue dimension present in rows but will not work when trying to roll up to the service level
case
when [Measures].[Incident Severity] = “1” Then -200
when [Measures].[Incident Severity] = “2” Then -100
when [Measures].[Incident Severity] = “3” Then -50
end
Can anyone advise on how I can correct the report so it will display correct totals?