Hi All,
I’m new to the community and to EazyBI. I need to create a report for probabilistic forecasting and to investigate if the team is increasing effectiveness. We do not work in Sprints, it’s a Kanban flow.
What I need in this report, is a list of issues:
- delivered in a specific time period (with possibility to filter them like e.g. Q3, Q4) with the name of issues
- considering only specific issue types like: story, spike, enabler, enhancement, maintenance and without their subtask within the report
- with possibility to filter them by issue type
What I need to see in the report: - lead time for every issue (statuses open to done - so the whole cycle) and cycle time from status Pulled to Done in days
- Time in specific statuses for them, like e.g. In Development, Rdy for Refinement - to identify where the team spent most of the time within the cycle/ lead time
Then - I guess it have to be a separate raport, based on what I’ve get from description above - Avg Cycle/ Lead Time for a specific issue type (story, enabler, etc.) with the possibility to modify the scope of Cycle Time (Pulled to Done/ Rdy for Refinement to Done)
- Percentile 50, 75, 90 for the specific range od data, like for e.g in Q4 or for specific Epic/Epics
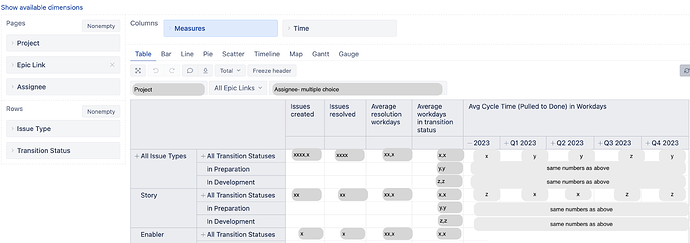
What I’ve already managed to get (using what I’ve found here), is something like that:
(I have covered up the results, but i hope those number are correct
To get Avg cycle time from Pulled to Done i used calculeted member formula:
CASE WHEN
(
[Measures].[Transitions to status],
[Transition Status].[Done]
) > 0
THEN
AVG(
Filter(
Descendants([Issue].CurrentMember, [Issue].[Issue]),
(
[Measures].[Transitions to status],
[Transition Status].[Done]
) > 0
),
DateDiffWorkDays(
(
[Measures].[Transition from status first date],
[Transition Status].[PULLED],
[Time].CurrentHierarchy.DefaultMember
),
(
[Measures].[Transition to status last date],
[Transition Status].[Done],
[Time].CurrentHierarchy.DefaultMember
)
)
)
END
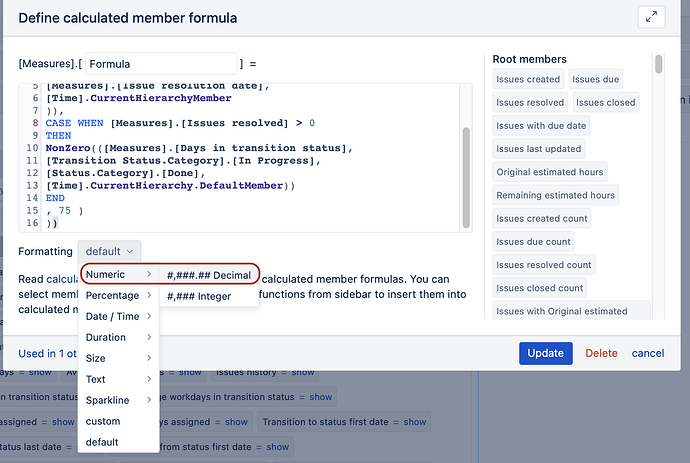
Still I do not now hot to get Percentiles - When I used calculated member formula like:
Cache(NonZero(Percentile(
Filter(
Descendants([Issue].CurrentMember, [Issue].[Issue]),
DateInPeriod(
[Measures].[Issue resolution date],
[Time].CurrentHierarchyMember
)),
CASE WHEN [Measures].[Issues resolved] > 0
THEN
NonZero(([Measures].[Days in transition status],
[Transition Status.Category].[In Progress],
[Status.Category].[Done],
[Time].CurrentHierarchy.DefaultMember))
END
, 75 )
))
I get results “yyyy mm dd” - literally - letters as in here, not numbers.
If anyone could help me to get data, I need, I’d be very, very grateful ![]()

