Hello.
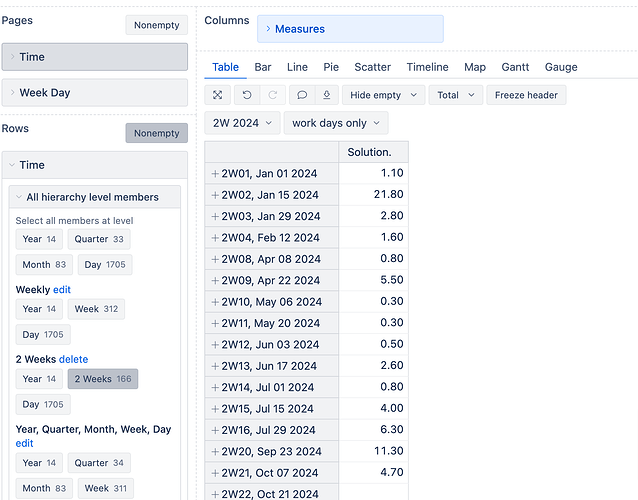
I would like to make a report with a throughput that is calculating how many items are finished with 2 weeks period of time on average.
I have found a formula but it seems to show it for a day.
– count average resolved issues for any weekday for a selected time period
Avg(Filter(
– access all days for a selected time period
DescendantsSet([Time].CurrentHierarchyMember,[Time].CurrentHierarchy.Levels(“Day”)),
– exclude weekend
NOT [Time].CurrentHierarchyMember.Get(‘Week day name’) MATCHES “Saturday|Sunday”
AND
– count till yesterday only to include full completed days
DateCompare([Time].CurrentHierarchyMember.StartDate, “Yesterday”) <=0
),
– count resolved issues or 0 if there are no resolved issues in a weekday
CoalesceEmpty([Measures].[Issues resolved] ,0)
)
Also is there an option to calculated it with SP, not isse count?
Hi @Agnieszka_Kochman
Thanks for posting your question!
Start with creating a bi-weekly hierarchy in Time dimension - see example here - Custom time hierarchies
Then define a new calculated member in Week Day dimension (Calculated members in other dimensions) with formula below to be able to filter the report on work days:
Aggregate(
  {[Week Day].[Monday],
  [Week Day].[Tuesday],
  [Week Day].[Wednesday],
  [Week Day].[Thursday],
  [Week Day].[Friday]}
)
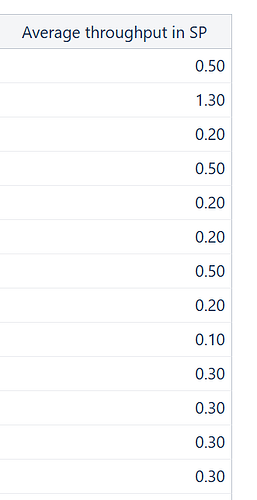
Then define a new calculated measure with formula below. This will calculate the average Story points resolved. If you’d like a different average calculation, you can replace “Story points resolved” with a different measure.
CASE WHEN
 DateCompare(
--end of period
   [Time].CurrentHierarchyMember.NextStartDate,
--today
   now()
   )<0
THEN
--completion measure, can use SP resolved as well
 [Measures].[Story Points resolved]
 /
--days in 2 week period
 10
END
Your report may look similar to the screenshot below
Best wishes,
Elita from support@eazybi.com
Hi @Elita.Kalane
Thank you for your response!
I made a report and its working, but its showing me same as you not whole numbers.
We are using a fibbonacci sequence so and I can see it is interpreting a 5 SP as 0.5. Can this be changed? Nevermind I have found that is dividing by 10, cause I wrote I wanted an average 
@Elita.Kalane one more question.
Because when I set a 2 weeks starting point in the time dimension, can this be different in different reports or only on some kind of project level it can be different?
Hi @Agnieszka_Kochman
Glad to hear you managed to build the report!
You can build more Time hierarchies with different Time ranges if needed. Whatever you build in a Time dimension in your report, will be available at the whole Account level. Therefor if you build another report in the same Account, you will still be able to select/use the Custom Time hierarchies you created. If you create a new/differnet Account, you’ll need to build the Custom Time hierarchy again.
Best wishes,
Elita from support@eazybi.com

