Hello i would like to manually import data to table in order to complete my plot.
is it possible to add a list of value through the “define report specific calculated member formula”?
it works when i put only one value but I need to set a list of specific values.
the size of the list will be (in my case) a constant (12 values)
thanks
Hi @clement_dd_64 ,
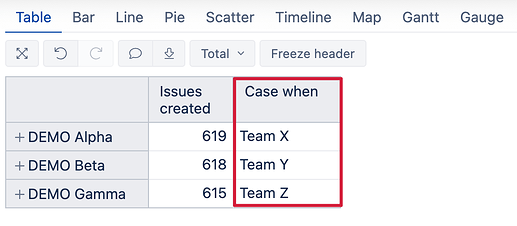
You can use the CASE statement to plot different values based on your dimension member names in rows.
For example, to get this type of report:
You can use the formula (change “Project” with the dimension you wish to use in your report):
CASE [Project].CurrentHierarchyMember.Name
WHEN "DEMO Alpha" then "Team X"
WHEN "DEMO Beta" then "Team Y"
WHEN "DEMO Gamma" then "Team Z"
END
best,
Gerda // support@eazyBI.com
Hello,
thanks for your answer! I will try by this way.
With all i have tried i have an other little question:
Is there a way to define a mesure (time spent for example) according to release date (and not according others date field)?.
Best regards.
Hi @clement_dd_64,
You can check this report: Version releases - Issues - Jira Demo - eazyBI
There is a measure for “Resolved issues in version at release date” that you can adjust for “Hours spent” using this formula:
SUM(Filter(
    [Fix Version].[Version].Members,
  DateInPeriod(
    [Fix Version].CurrentMember.get('Release date'),
      [Time].CurrentHierarchyMember
    ) AND ([Time].CurrentHierarchy.DefaultMember,
      [Measures].[Issues created]) > 0),
  -- hours spent in version at release date
  CoalesceEmpty(
    Cache(
      Sum(PreviousPeriods([Time].CurrentHierarchy.Levels("Day").DateMember(
      [Fix Version].CurrentMember.get('Release date')).NextMember),
      [Measures].[Hours spent]
      )
    ),0
  )
)
best,
Gerda
Thanks you all the answers works perfectly 
1 Like
