Hi
I’m trying to create a chart to show, per story point “bucket”, the average, minimum and maximum cycle time. so for example, where we have a number of issues defined as 3 story points, what’s the average cycle time for that along with the minimum and maximum.
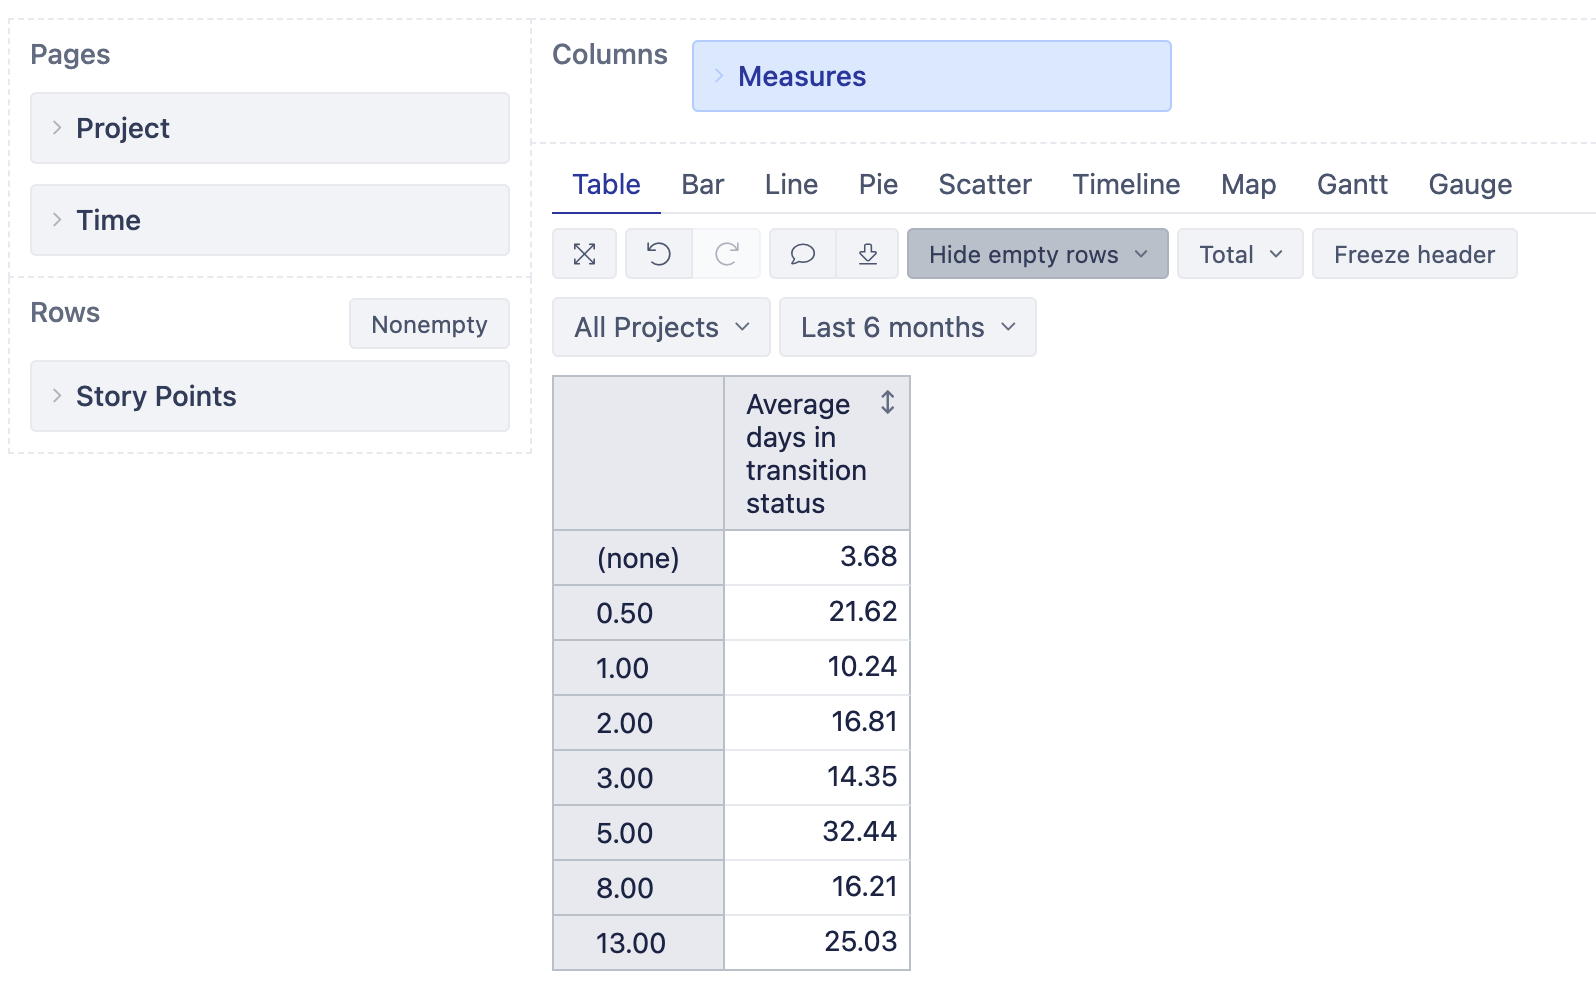
I’ve imported the story points dimension and used the average days in transition status to (I think) show the average cycle time per bucket, but I can’t figure out how to add the maximum and minimum. Ideally I’d like the chart to look like the following, but with the maximum and minimum as two separate lines on the same chart.
Many thanks for any light you can shed on this one.
Hi,
You could try using “Min” and “Max” functions to calculate two more columns in the report and show min, max values among all story point buckets.
https://docs.eazybi.com/eazybi/analyze-and-visualize/create-reports#Createreports-Addstandardcalculationsbasedonaselectedmeasure
Martins / eazyBI
Thanks Martins.
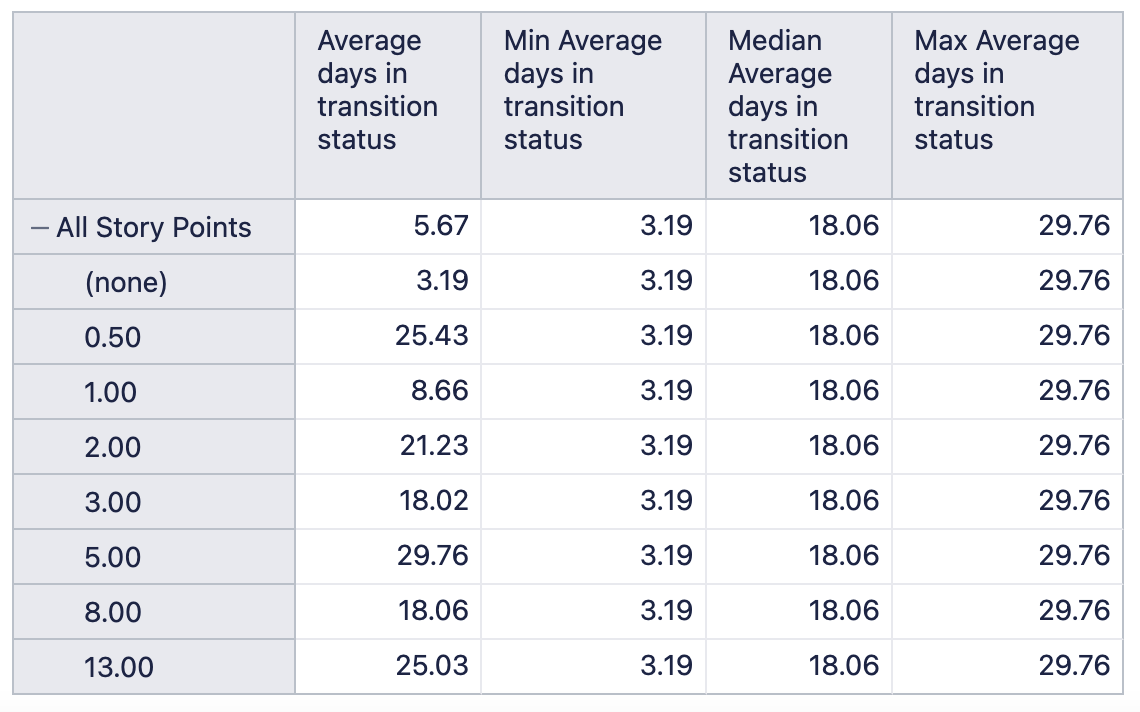
When I try to do that, it just gives me the minumum value, the median value and the maximum value from the first column, as opposed to taking each row individually and looking at the data behind it that calculated that value.
@Mark_Crawley
What do you mean by saying “data behind it” exactly?
Is it perhaps Min/max/median result for the issues with the particular story point value? Is that what you are after?
In that case, you would need some custom-calculated measures.
Try this formula:
Min(
DescendantsSet([Issue].CurrentHierarchyMember,[Issue].[Issue]),
[Measures].[Days in transition status]
)
This is quite a complex query as it iterates through all imported issues for each report row.
Martins / eazyBI
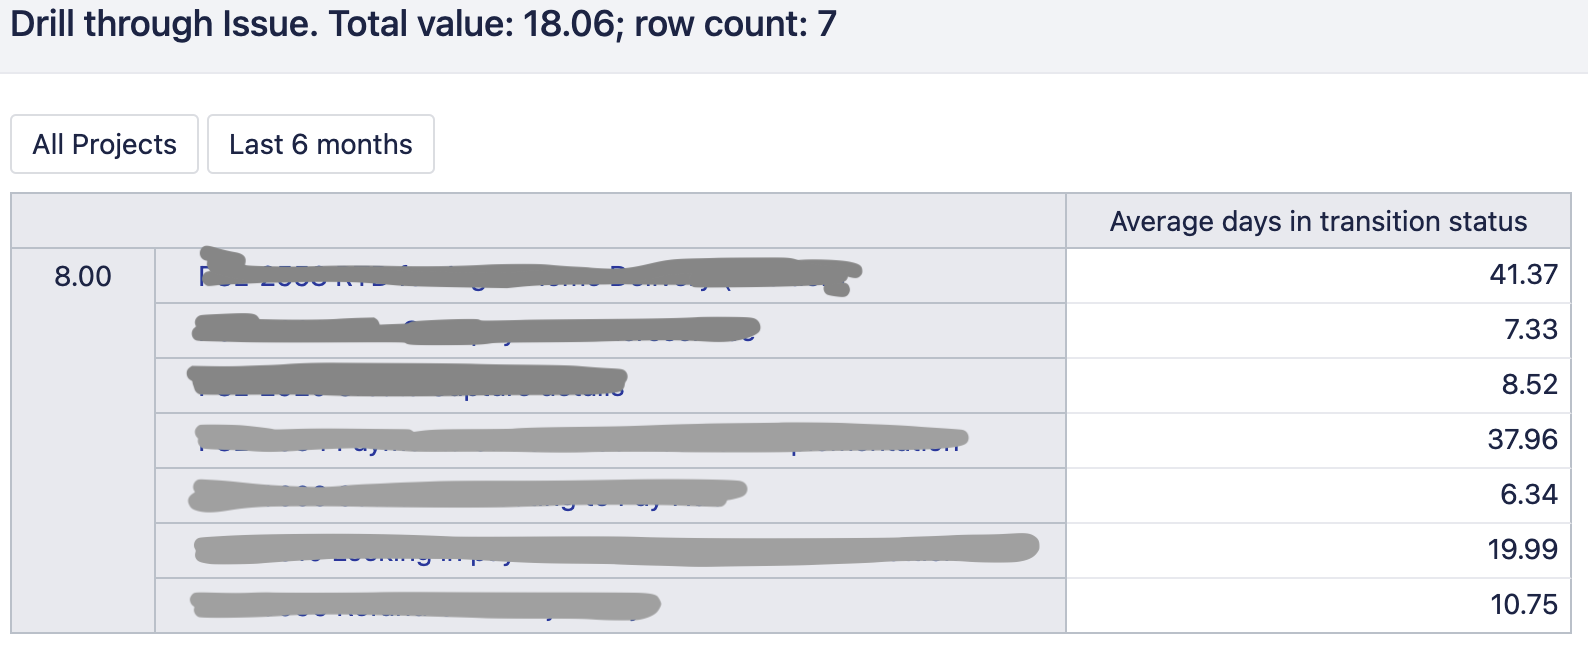
That’s closer to what I am looking for, however the calculaton doesn’t produce the result I was expecting. The first screenshot shows the result, but for example if I "drill through issue’ with the 8.00 row in the Average days in transition status column it shows me the data in the second screenshot. So I’d like the table to show the minimum for the 8.00 row as 6.34 and the maximum as 41.37.
@Mark_Crawley
If you want to return the results from average values, you could try this formula:
Min(
DescendantsSet([Issue].CurrentHierarchyMember,[Issue].[Issue]),
[Measures].[Average days in transition status]
)
Martins / eazyBI
That works perfectly, thank you so much!!