Giorgos
February 9, 2025, 10:57am
1
Hi Community,
Based on these measures, relates Kpis are produced and reach trhe management. Do you think that these can be created in EazyBi? Thank you.
Hi Giorgos,
Sure thing!
Let’s go through this step by step.
You need to import custom fields “Incident Escalated” and “Categorization” into eazyBI;
Go to your account in eazyBI, in the Source Data tab, click Edit for your Jira source;
Go to the “Custom fields” section, find these two fields in the list, select all the available checkboxes for them, and run the import;
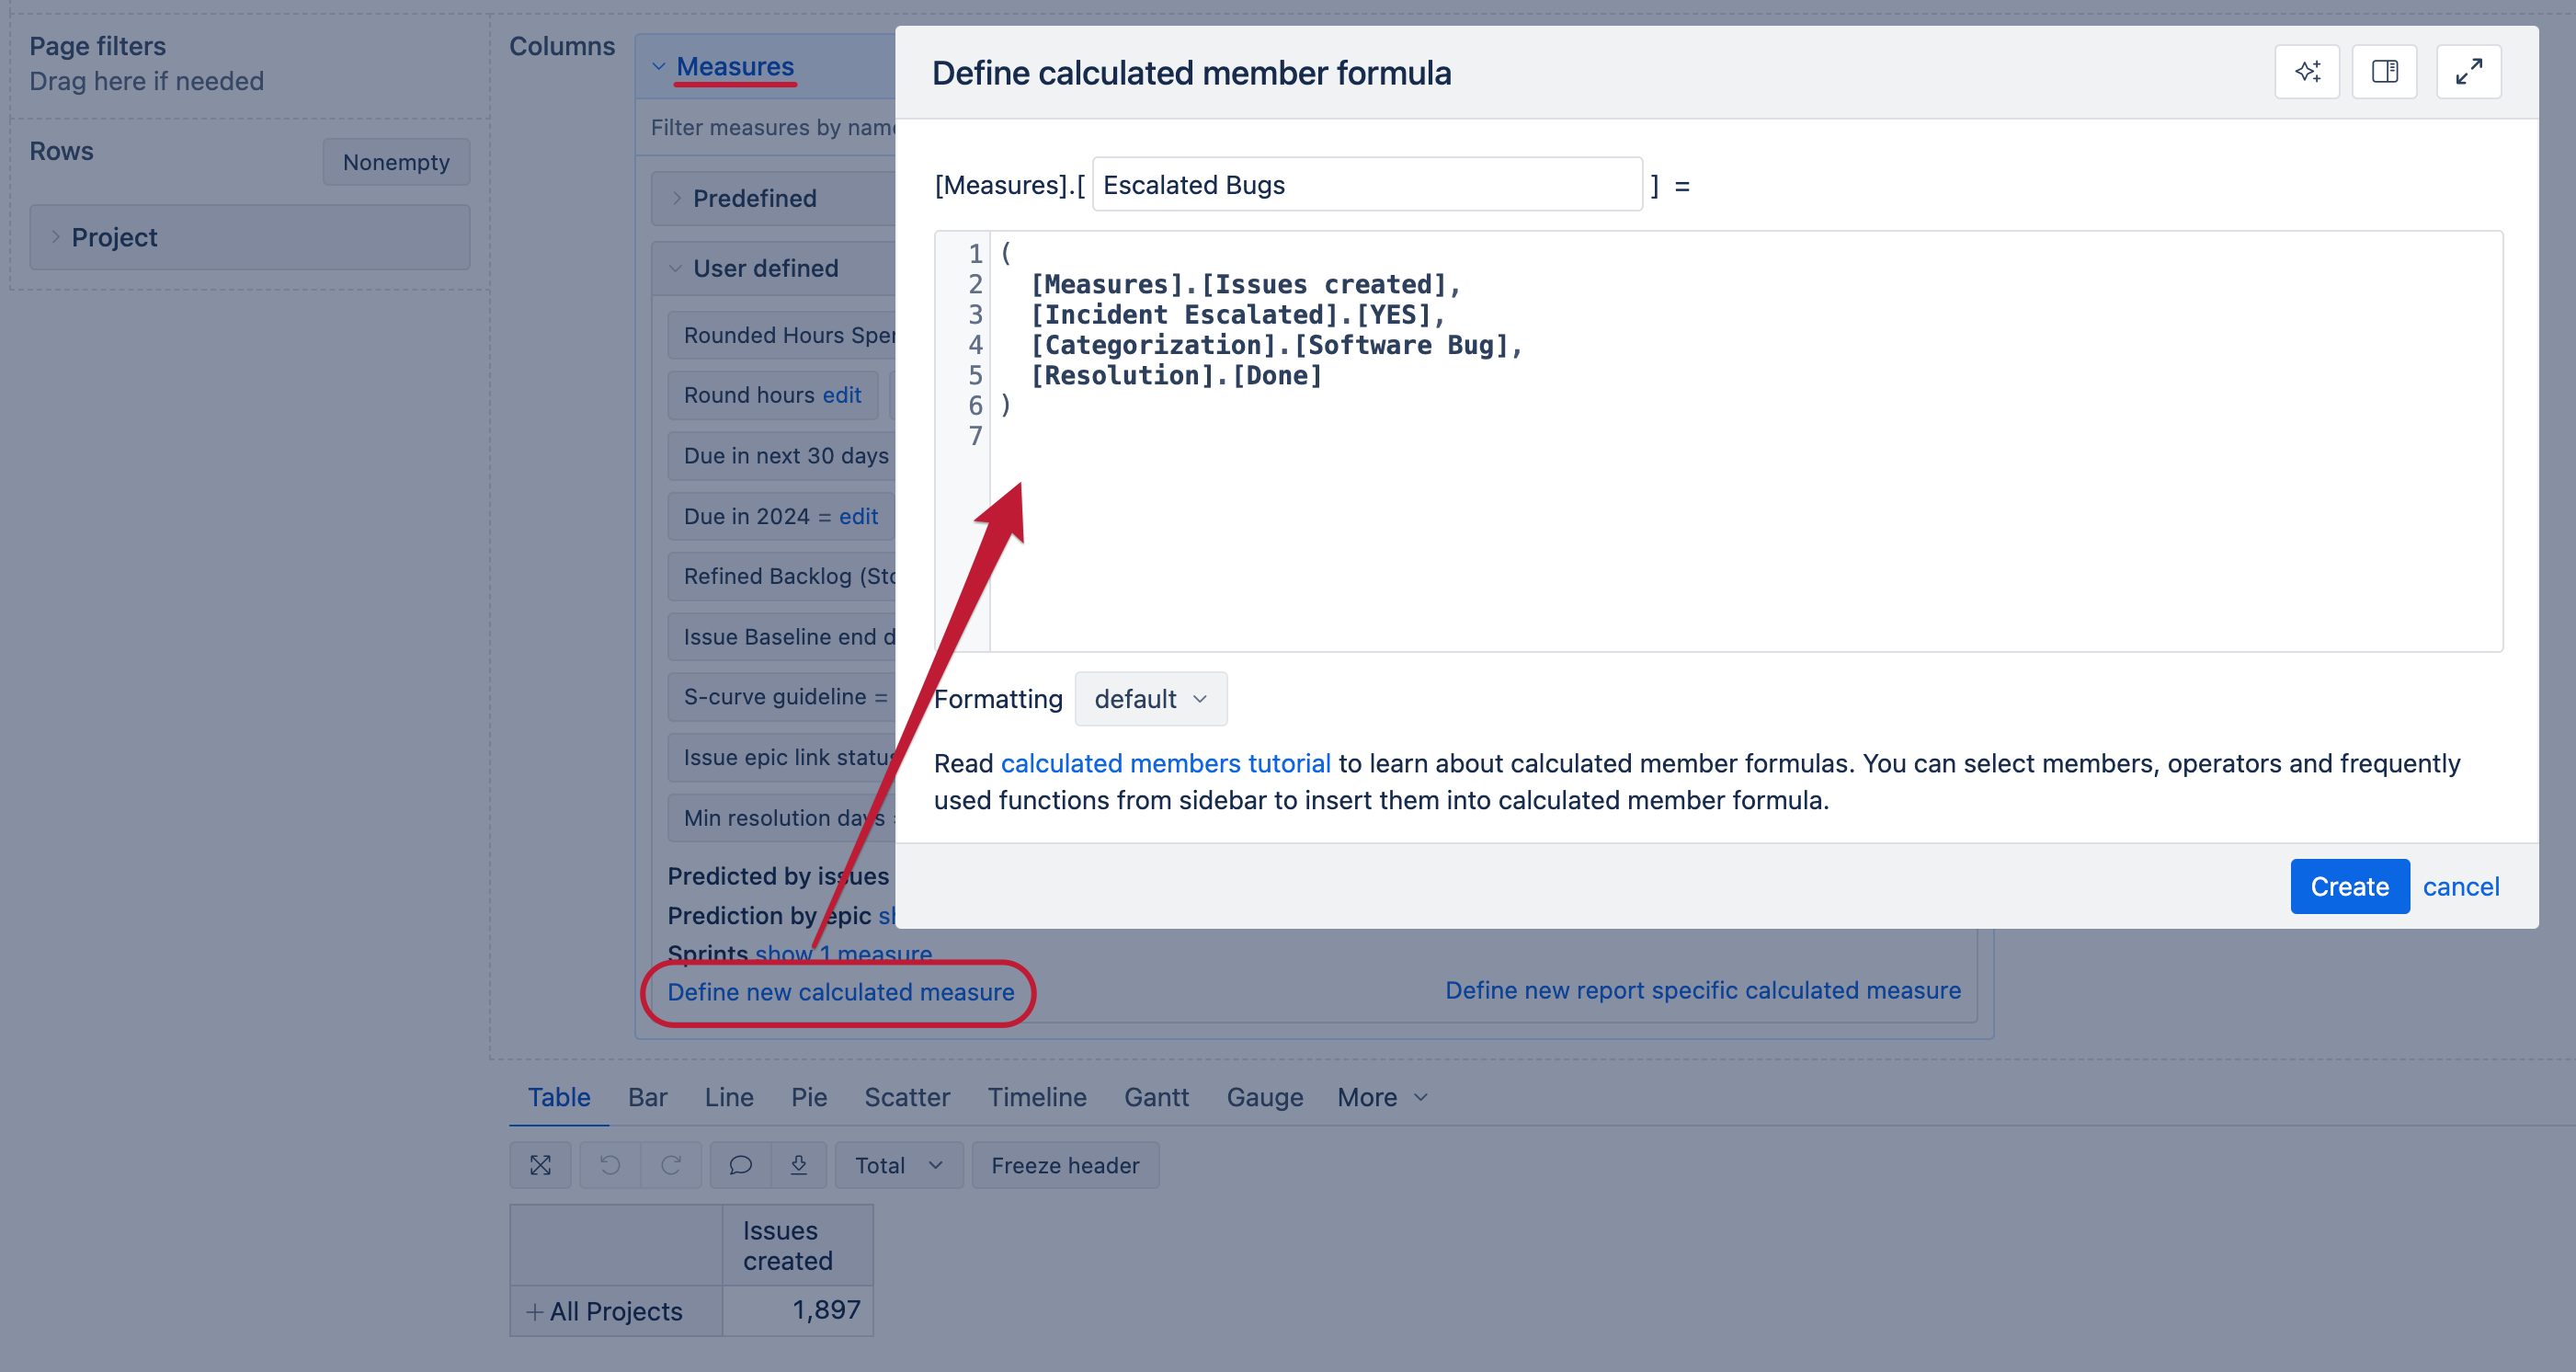
After the import finishes, go to the Analyze tab and create a new report;
Choose any dimension, for example, Project , and drag it to the Rows section;
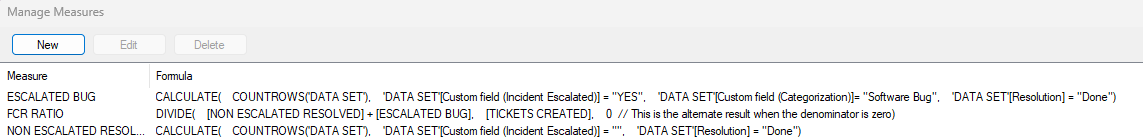
Next, in the Measures dimension define 3 new measures:
The formulas would be something along these lines:Escalated Bugs:
(
  [Measures].[Issues created],
  [Incident Escalated].[YES],
  [Categorization].[Software Bug],
  [Resolution].[Done]
)
Non Escalated Resolved:
(
  [Measures].[Issues created],
  [Resolution].[Done]
)
-
(
  [Measures].[Issues created],
  [Incident Escalated].[YES]
  [Resolution].[Done]
)
FCR Ratio:
CASE WHEN
[Measures].[Issues created] > 0
THEN
(
  [Measures].[Escalated Bugs]
  +
  [Measures].[Non Escalated Resolved]
)
/
[Measures].[Issues created]
ELSE
0
END
Set the formatting for this one to Numeric → Decimal or Percentage.
Let me know if this works as expected!
Giorgos
February 17, 2025, 7:29am
3
Hello @nauris.malitis , it really works, made some changes based on needs and it is fine. Actually was quite simple. Really thank you.