Merging two dimensions together to create one calculated member

Hi EazyBI,

I have two dimensions, one is a project manager field and another is an owner field. I am looking to merge them together as one calculated member to display the reporting information. Right now if I pull the dimensions into a report it will show me all owners under all project managers, whereas I am looking to show all issues a person is an owner and project manager of and run measures from there.

Hi @dcachia

You can add both dimensions to Pages and use them as filters. Select the same user for both filters, and only issues corresponding to both of them will show up.

Another solution would be to define a new dimension in the Advanced settings by adding the following code that checks if the Issue has the same project manager and owner, if yes, then the value of this field would be the name of this user:

# Project manager is the same as the Owner
[jira.customfield_manager_owner]
name = "Manager and Owner"
data_type = "string"
dimension = true
javascript_code = '''
if (issue.fields.customfield_NNNNN && issue.fields.customfield_MMMMM &&
    issue.fields.customfield_NNNNN == issue.fields.customfield_MMMMM) {
  issue.fields.customfield_manager_owner = issue.fields.customfield_NNNNN;
}
'''

Replace the NNNNN and MMMMM with the ID’s of the Project manager and Owner custom fields (can be found in import options by hovering over the name). Save the settings, go to the import options, select this “Manager and Owner” field to import as a dimension, and trigger the import.

Now you can use this dimension to filter issues by users that are both the Project manager and the Owner of these issues.

Best regards,
Nauris / eazyBI

Hi @nauris.malitis,

I am not sure is this would work as I need to display both the project manager and owner, plus if someone is both. I am essentially building out a capacity report where if someone is:

A Project manager it takes up X hours per week of time
A Owner it takes up Y hours per week of time
Both is takes up (X+Y)/2 hours per week of time

If there is a way to display the names of the team on the X axis, the number of projects in total they are a PM,owner, or both on the Y I can then create a measure from there for display
image

Weekly capacity measure:
[Status].[In Queue]*5
+
[Status].[In Progress]*5

Hi @nauris.malitis,

Just following up to see if there’s any insight you can offer

Hi @dcachia

Sorry for the late reply! Completely missed this thread.

First of all, are all of your Owners also in the role of the Project Manager in at least one issue (or vice versa)?
For example, a user is added to the Project Manager dimension only if the user is assigned as a Project Manager to at least one issue (or has been in the past).

This needs to be taken into account when choosing the dimension to plot the data to so that you don’t miss any users.

Let’s assume that all of your Owners are also Project Managers and use the Project Manager dimension in the Column section.

Create a new measure in the Measures dimension “Issues with same Owner and PM” with the following formula:

-- annotations.drill_through_non_empty=false
Sum(
  Descendants([Project Manager].CurrentMember,[Project Manager].[Project Manager]),
  (
    [Measures].[Issues created count],
    [Owner].[Owner].Members.item([Project Manager].CurrentMember.Name),      
    [Project Manager].CurrentMember
  )
)

Next, create a measure “Issues with this Owner only”:

-- annotations.drill_through_non_empty=false
NonZero(
  Sum(
    Descendants([Project Manager].CurrentMember,[Project Manager].[Project Manager]),
    (
      [Measures].[Issues created count],
      [Owner].[Owner].Members.item([Project Manager].CurrentMember.Name),        
      [Project Manager].DefaultMember
    )
  )
  -
  [Measures].[Issues with same Owner and PM]
)

Next, create a measure “Issues with this PM only”:

-- annotations.drill_through_non_empty=false
[Measures].[Issues created count]
-
[Measures].[Issues with same Owner and PM]

Now that these three measures are counting issues by their owners and PMs, you can define the final measure “Weekly capacity”, where you add the weight “X” and “Y” to the report:

[Measures].[Issues with this PM only] * X 
+
[Measures].[Issues with this Owner only] * Y
+
[Measures].[Issues with same Owner and PM] * ((X+Y)/2)

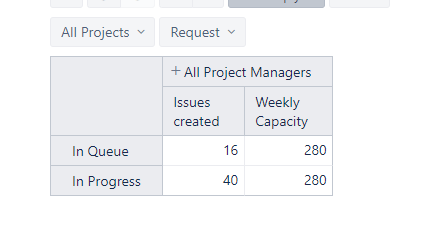
You can add the “Status” dimension to Rows to divide these issues by their current statuses.

​Let me know if this fits your use case or if you have any additional questions on this!
​Best regards,
​Nauris

Hi @nauris.malitis this has worked, thank you! I will just have to do some minor filter tweaking for different workflow status’s but this has helped a lot

1 Like

Hi @nauris.malitis

I think I have a similar problem

I have 5 assignment fields and 5 time fields

Assign 1
Hour 1

Asig 2
Hour 2

…

The assignees are not the same and I need a dimension that can group everyone within a large dimension called “Project Assignments”, is it possible to execute this?

Hi @Marcelo_Ignacio_Cid1

Are there 5 different assignment custom fields or is there one assignment custom field with five possible single-select values? (the same goes for time fields)

There are 5 different assignment fields for both time and assignments.