I am trying to create a static scale between 99,5% and 100% on my default Y axis that measures Availability in a Line diagram.
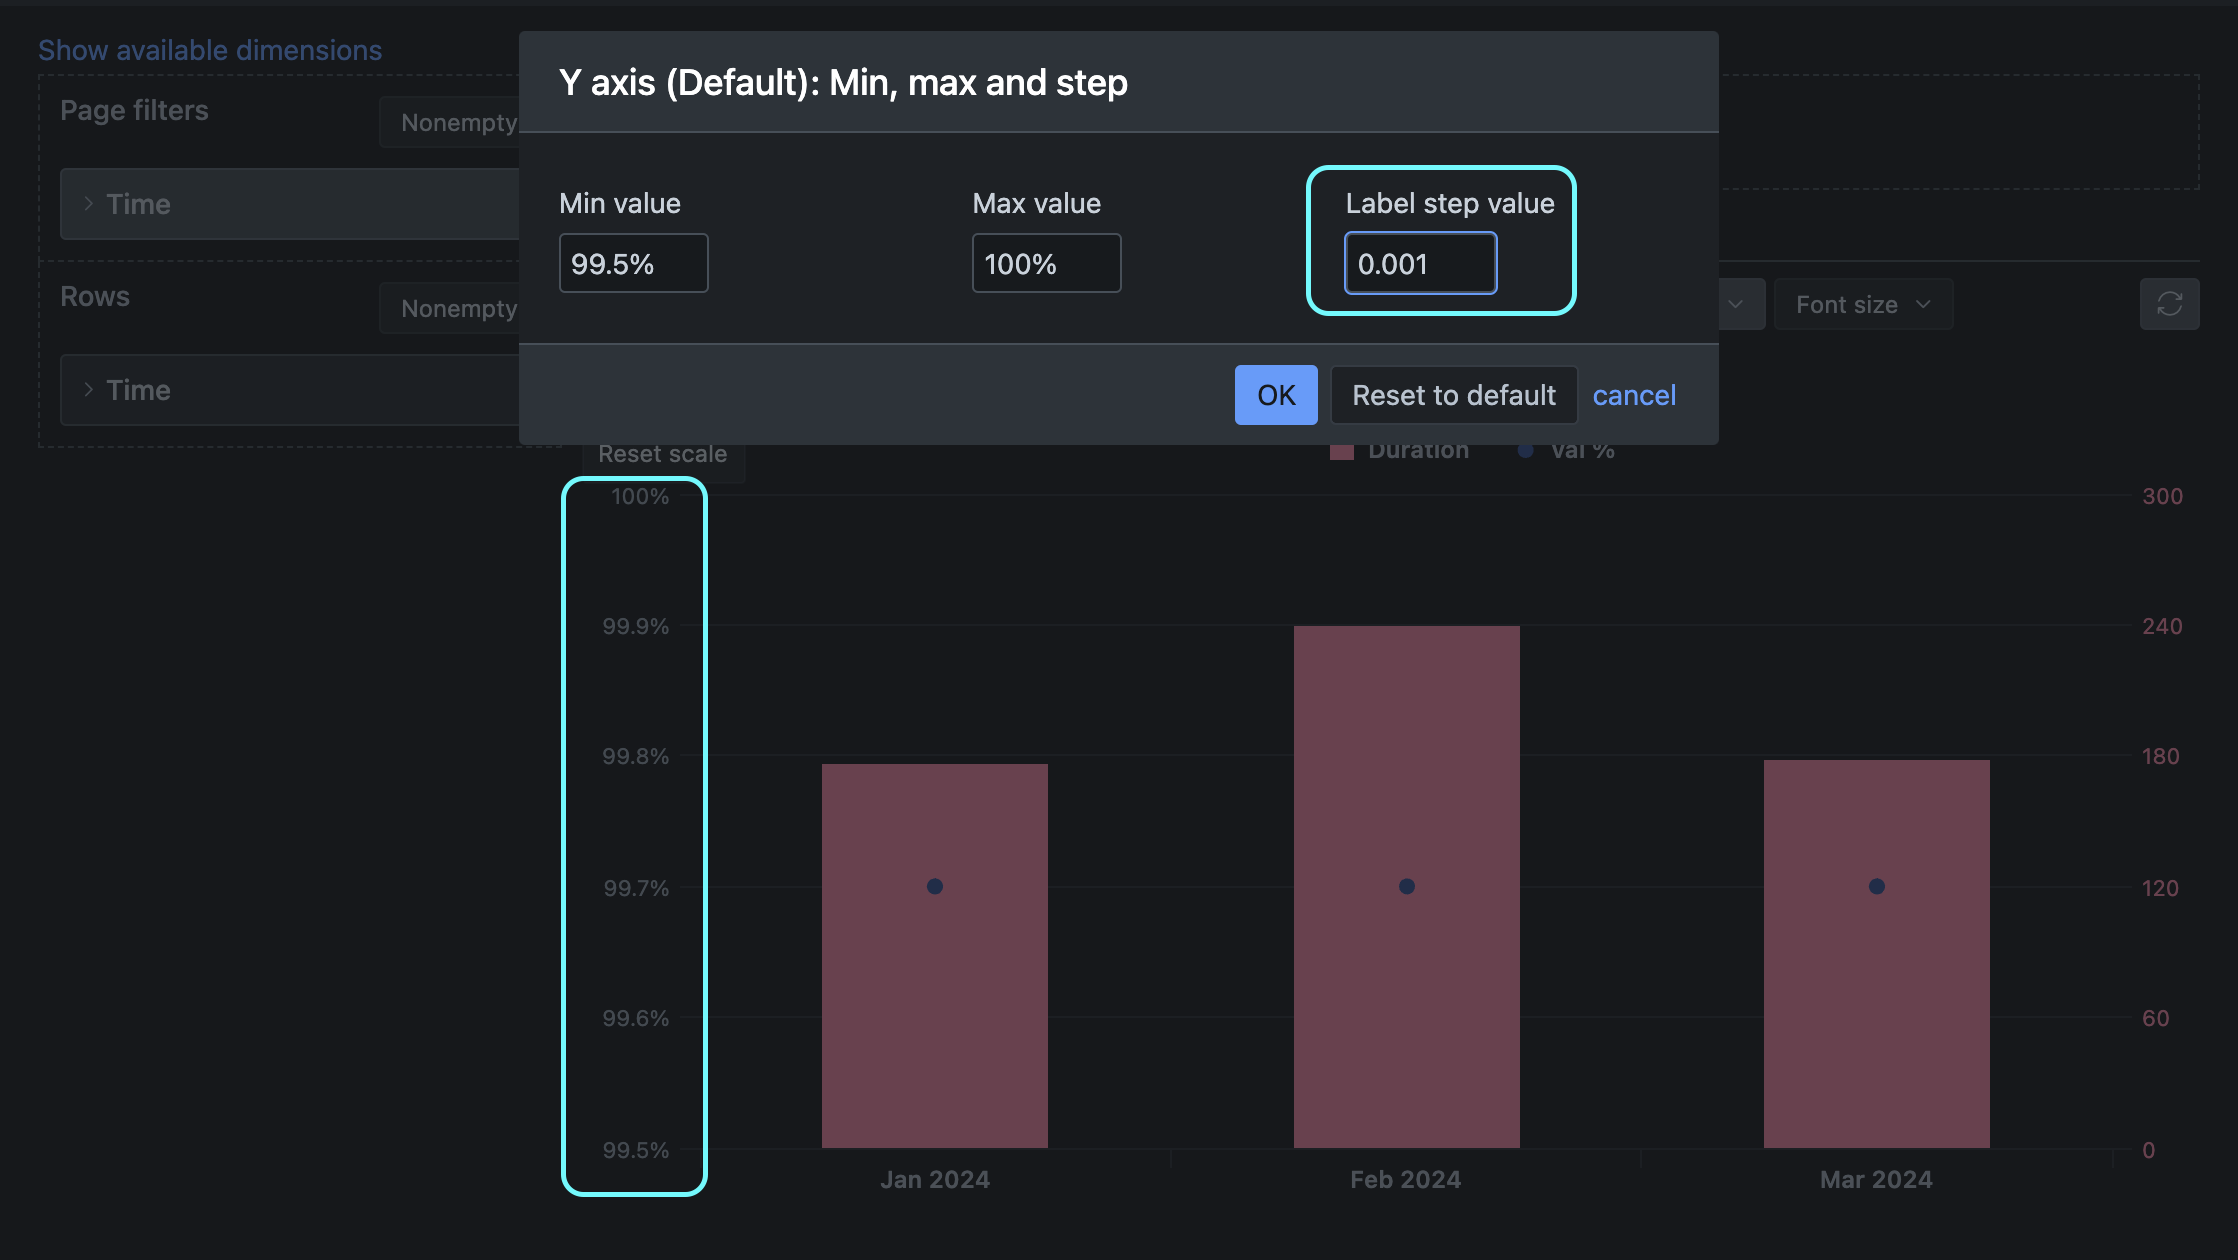
Even though I have configured 99,5% as the min, and 100% as the max, the output on the Y axis gives me values both below (99.48%) and over (100.08%) the set limits:
The percentages range is slightly adjusted because the grid lines are shared with another Y axis representing minutes.
Set the Label step value to 0.001 so eazyBI would draw the line for each tenth of a percent.