Hello all,
I have 2 charts: cumulative flow of Problem Reports and Throughput chart showing of Inflow/Outflow of Problem Reports. However, comparing the data between these two, I see several discrepancies.
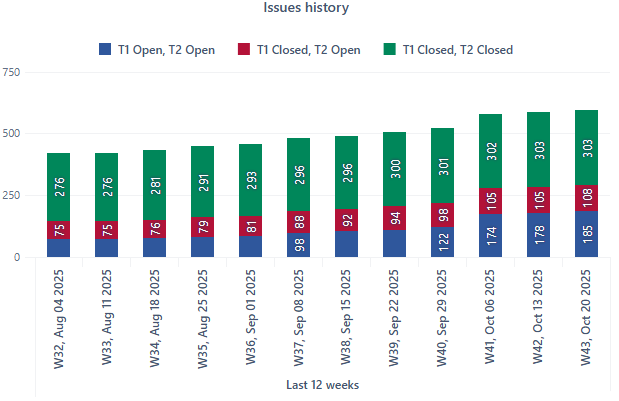
Theumulative flow diagram of Problem Reports is based on three grouping of Statuses:
T1 Open/T2 Open = aggregation of New, Classified, Analyzed, Accepted, To be integrated, To be verified, On Hold, Reopened
Aggregate({
  [Status].[ToDo],
  [Status].[OnHold],
  [Status].[Analysis],
  [Status].[Implementation],
  [Status].[Verification]
})
T1 Closed/T2 Open = Realized
Aggregate({
  [Status].[Realized]
})
T1 Closed/T2 Closed
Aggregate({
  [Status].[Done],
  [Status].[Canceled],
  [Status].[Duplicate]
})
And looks like below chart
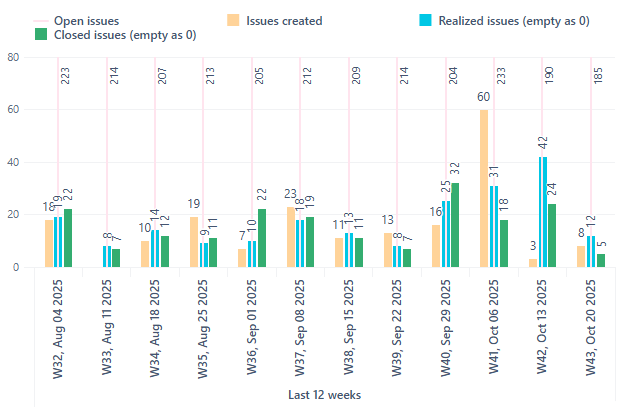
The 2nd chart is the throughput chart that shows inflow, outflow and open issues. Inflow = Issues created built-in measure; Outflow split into two: Realized issues and Closed issues
Realized issues measure :
([Measures].[Transitions to status], [Transition Status].[Realized])
Closed issues measure :
Aggregate({
  ([Measures].[Transitions to status], [Transition Status].[Done]),
  ([Measures].[Transitions to status], [Transition Status].[Canceled]),
  ([Measures].[Transitions to status], [Transition Status].[Duplicate])
})
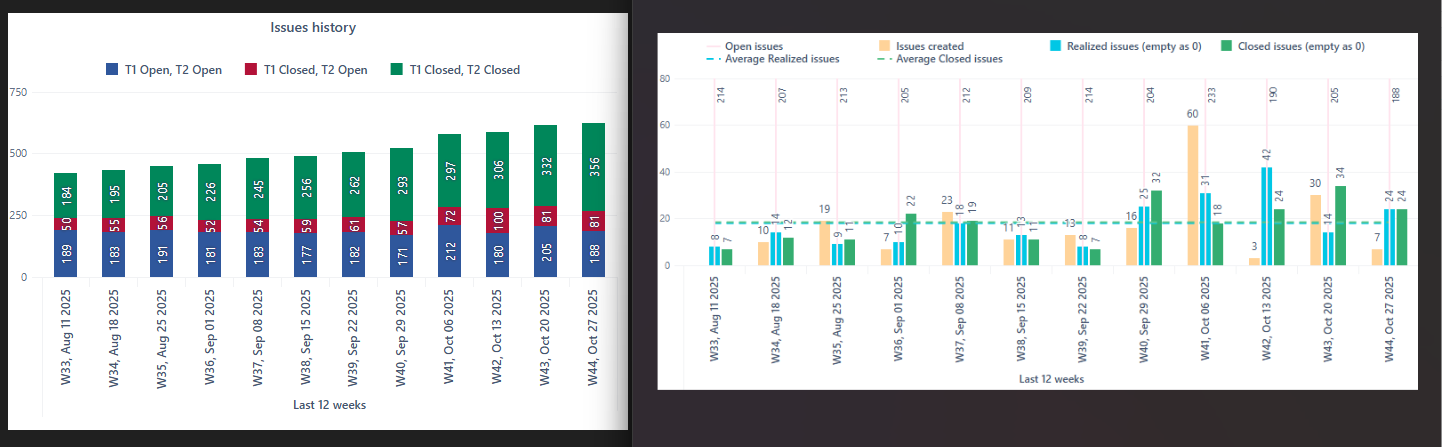
Crosschecking the both charts:
Open issues ←→ T1 Open/T2 Open => between CW42 and CW43 there’s a difference of
7 issues, so one would assume there’s an inflow of 7 issues, however, in the 2nd chart, there’s been 8 issues created
Realized issues ←→ T1 Closed/T2 Open => 3 issues difference between CW42-CW43 but the Realized issues shows 12 instead
Closed issues ←→ T1 Closed/T2 Closed => despite closing 5 issues in CW43, the CFD for doesn’t show any difference between CW42 and CW43
I’ve been racking my brains on what could have cause this discrepancy and how can I resolve it.
Additional information, when I drill through Closed issues ←→ T1 Closed/T2 Closed for CW43, the list of issues shown in Closed issues, I can actually find listed also in T1/T2 Closed drill through.
Any help and feedback would be appreciated. Thanks!