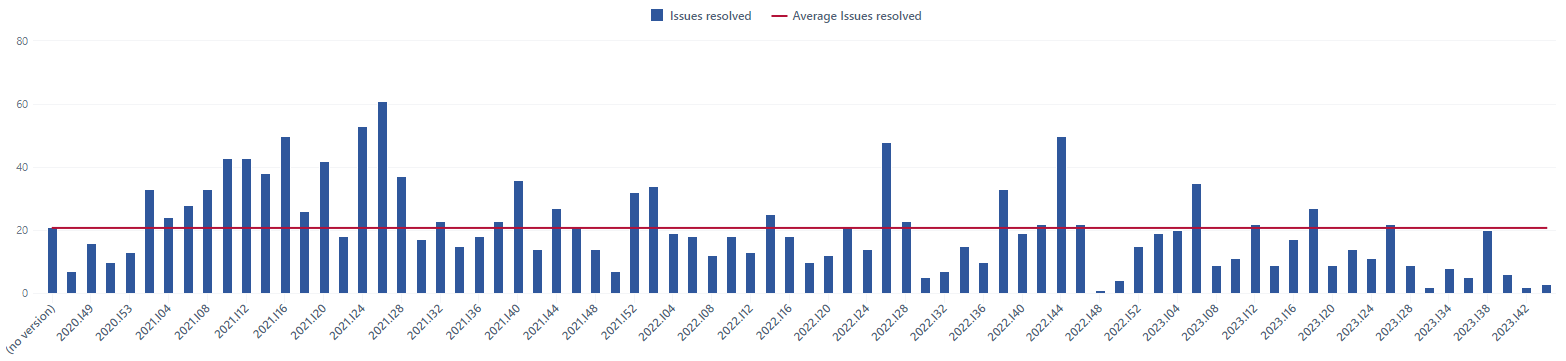
So I am trying to do a graph where I can see in the x axis the fixed versions and on the y axis the number of features that were resolved/completed. However the number of features completed is not the correct one because some features have more than one version on them and I only want to count the last version of the features, so i dont count double. If anyone could help me I would appreciate ![]() !
!
Hi,
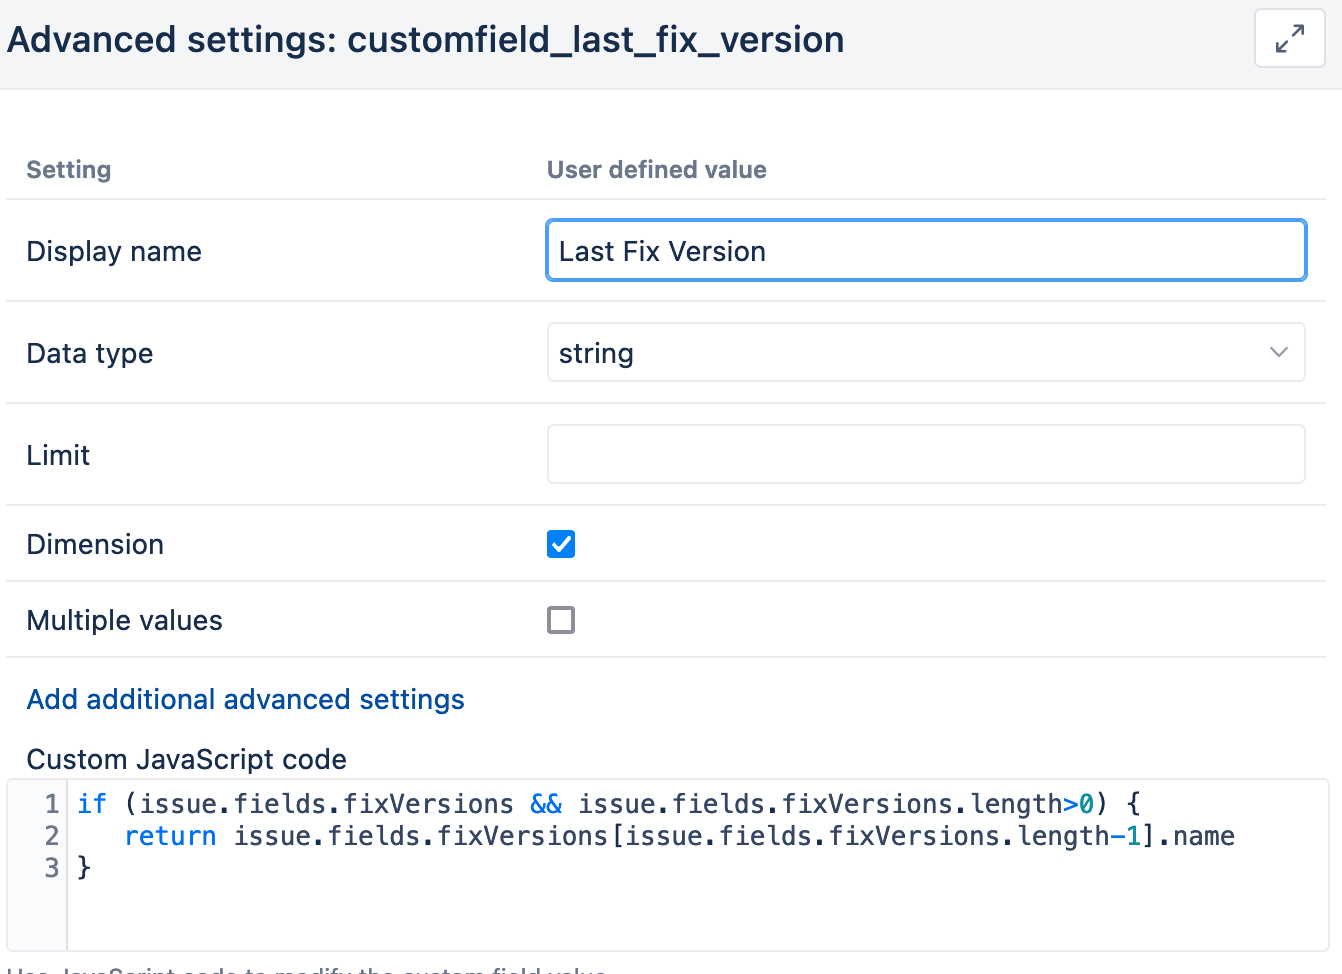
The recommended solution is to implement a Calculated Custom field with a Javascript, creating a new dimension. This dimension would show the count of issues by the last Fix Version of this issue:
https://docs.eazybi.com/eazybi/data-import/data-from-jira/jira-custom-fields/new-calculated-fields
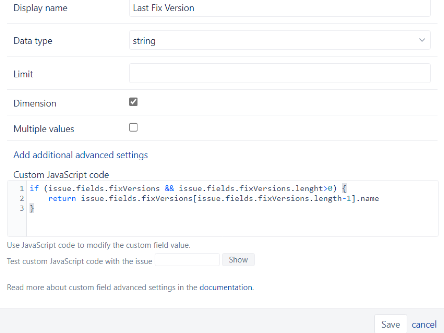
The configuration of the custom field could look like this:
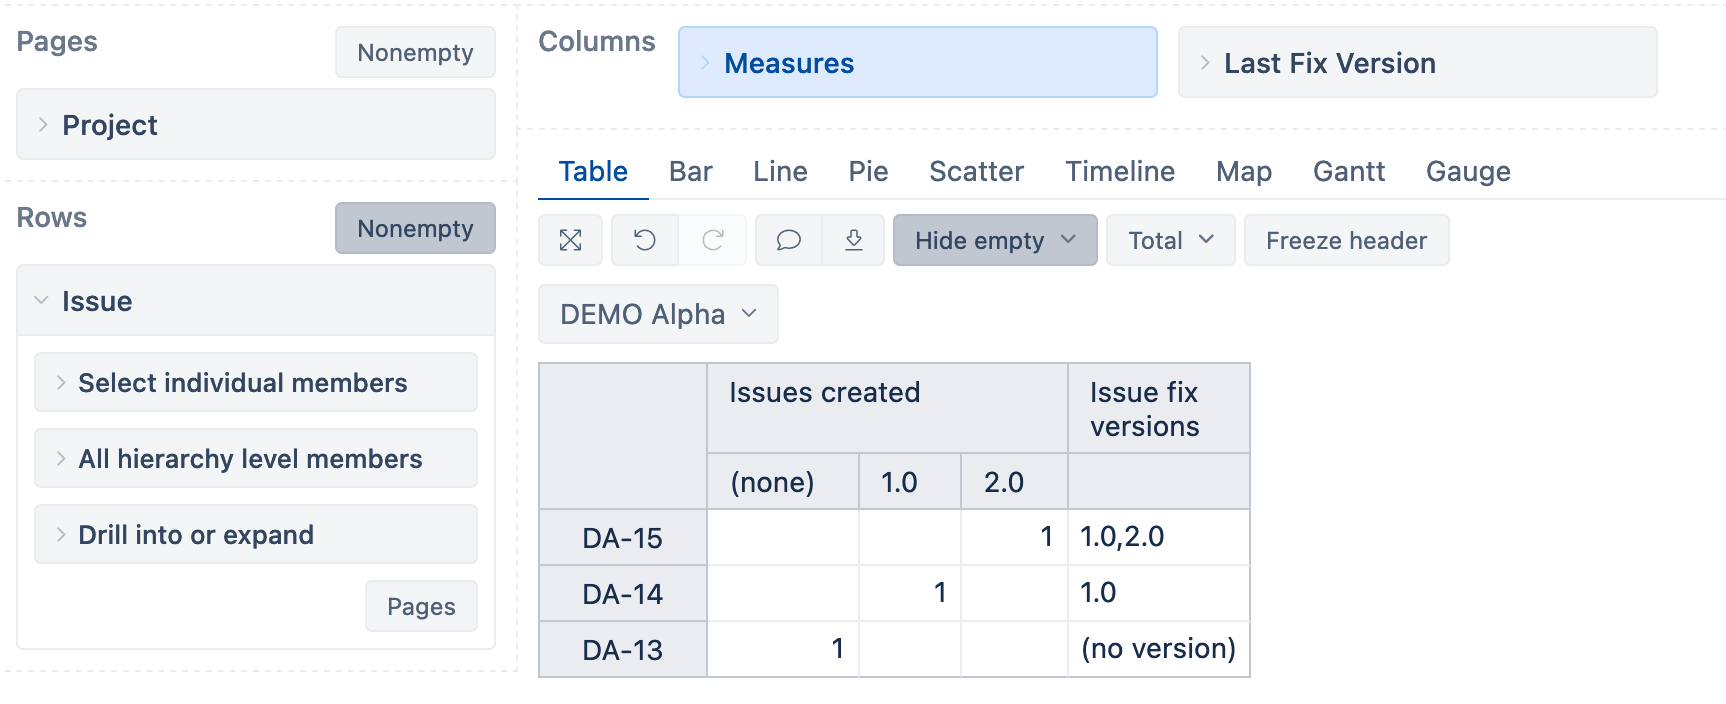
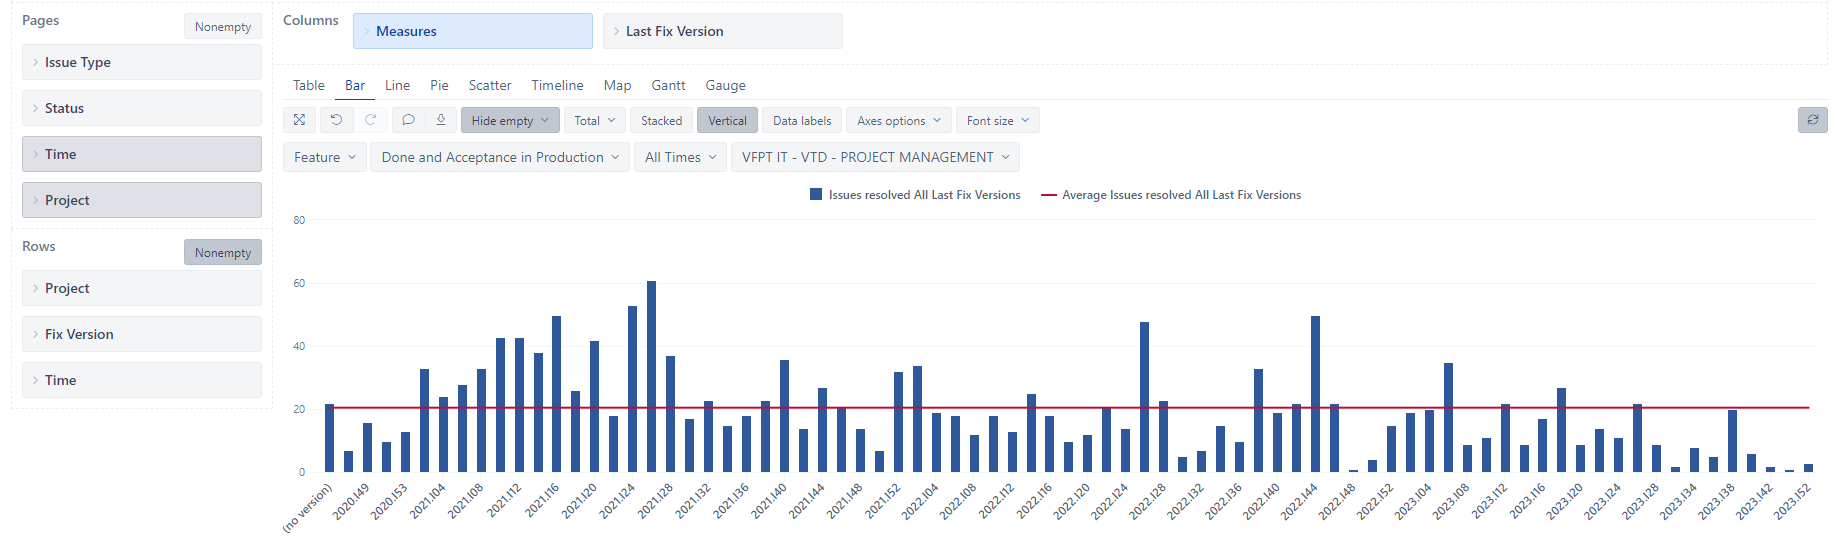
Once you use this dimension in the report, issues will be counted by the last fix version:
Kindly,
Janis, eazyBI support
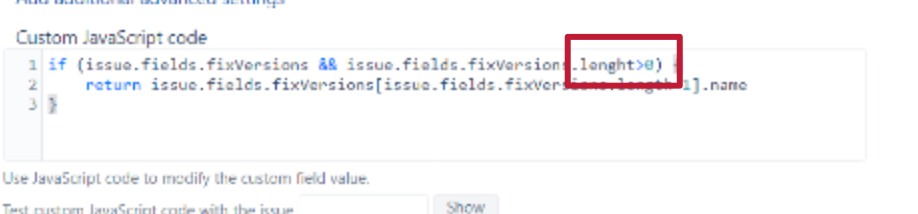
Hi sorry to bother again but I tried doing that and it stayed the same.
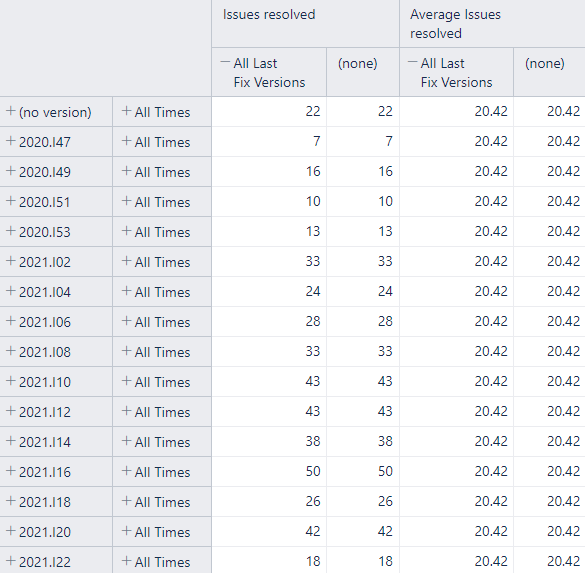
Below follows the dimension i created
Any thing I am doing wrong ?? Thanks in Advance!