Hi, I have created a report displaying story points completed of last 10 sprints. Now I want to add a fixed line which can be called as a target line for team to reach that goal. I have defined different Measures of last 10 sprints in Row and Project in Columns. I am now not able to add a fixed line in the chart. Can anyone please suggest a solution for the same. Adding a screenshot for reference.

1 Like
Hi @prai,
If you need a constant numeric value in a calculated measure, you can specify the value in the measures formula. Please see the picture below:
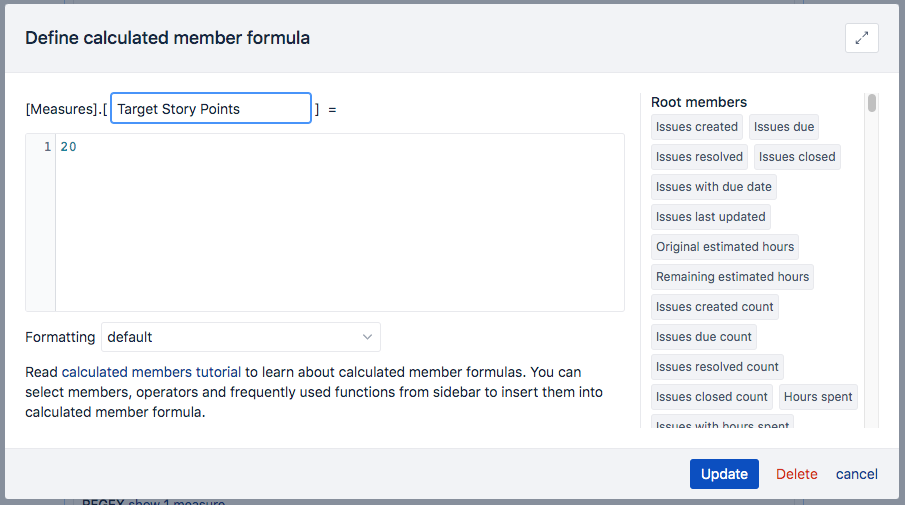
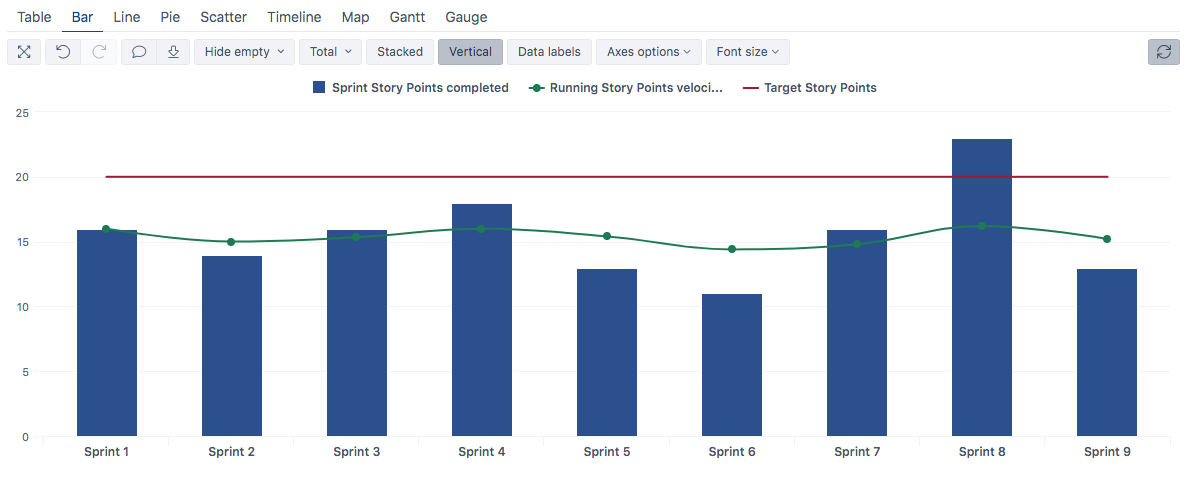
After adding the measure to the report, you should see the expected result:
The eazyBI documentation page has more information regarding calculated measures - https://docs.eazybi.com/eazybijira/analyze-and-visualize/calculated-measures-and-members.
Best,
Roberts // support@eazybi.com
1 Like
hi,
Could this line be set to change based on a page filter selection?
i.e. Project dimension in the page - as i select different projects the target changes?
Cheers,
Gav
Hi @gav.yates ,
You can create a CASE WHEN construct in the calculated measure formula, to return a different value for different dimension members. An example with the mentioned Project dimension could look similar to the one below:
CASE [Project].CurrentMember.Name
WHEN 'PROJECT NAME 1'
THEN 20
WHEN 'PROJECT NAME 2'
THEN 35
WHEN 'PROJECT NAME 3'
THEN 16
END
See more details on this on our documentation page - CASE statement - eazyBI.
Best,
Roberts // support@eazybi.com
Hi all.
I’ve created the fixed number calculated measure to use as the target - how do I switch that one measure to show as a line on stacked bar chart of the other data?
Thanks, Phil.
Hi @phil.vallender,
To change a metrics representation in a chart, click on its legend beside its name, and change the “Type” to “Line”. Please see the eazyBI documentation page for more details - Customize chart.
Best,
Roberts // support@eazybi.com
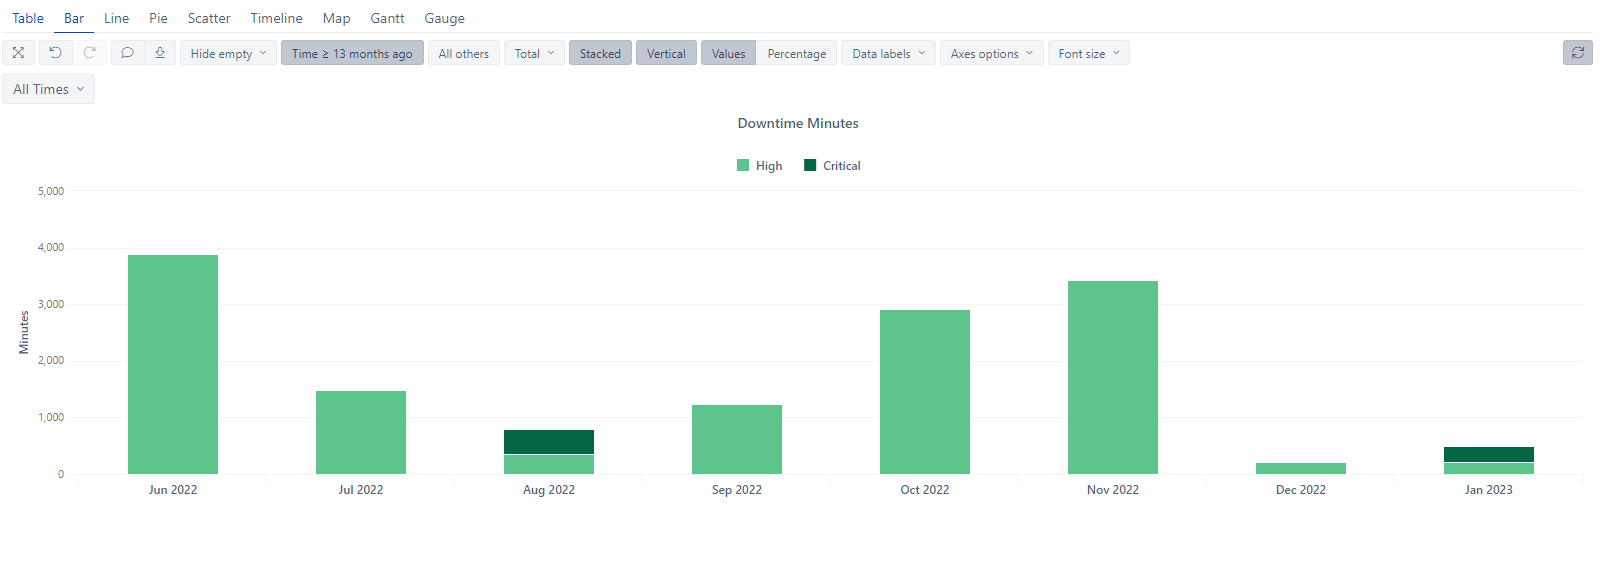
Hi, @roberts.cacus this seems to be a great advice. However, I dont quite get what I need.
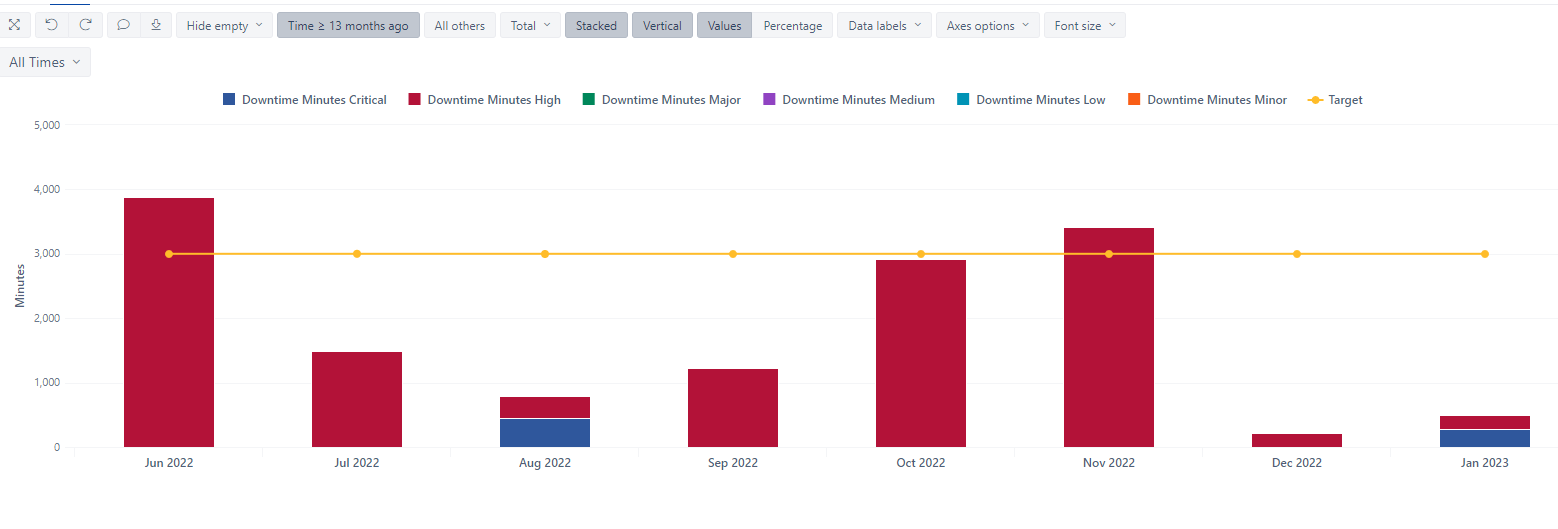
Im using a stacked chart and when i add this custom made target line, it changes my graph and not sure how to make it look like the original:
Hi @Osvalda ,
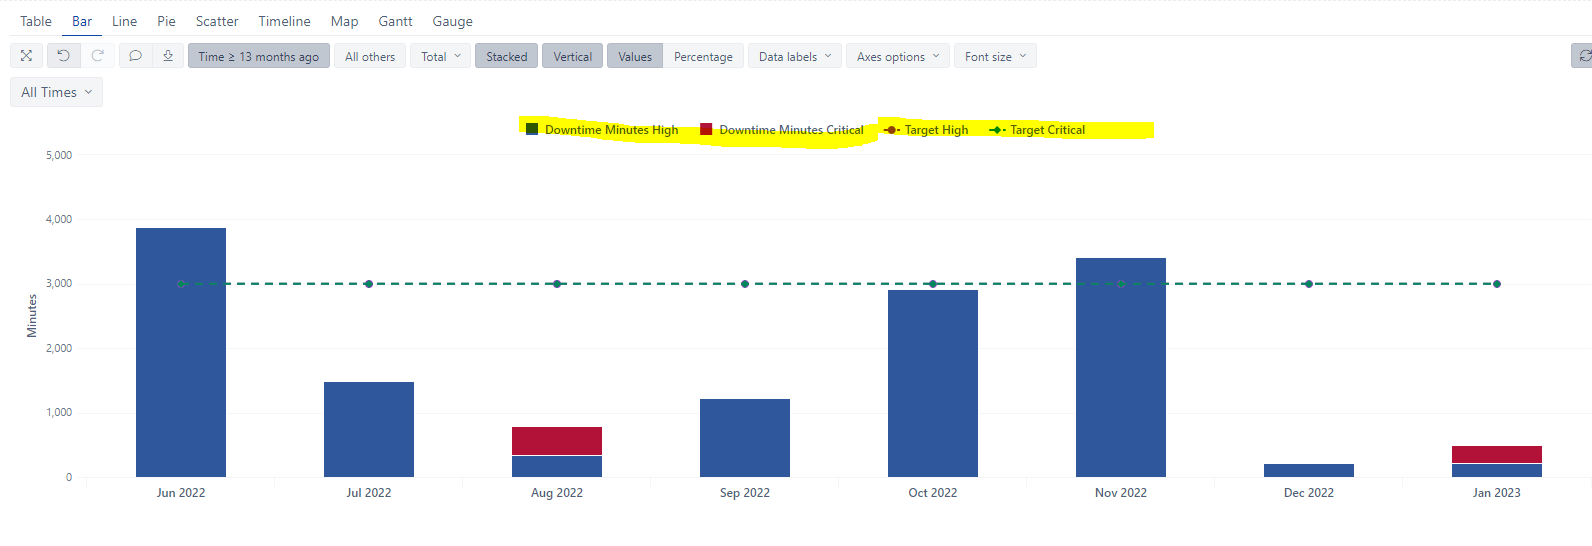
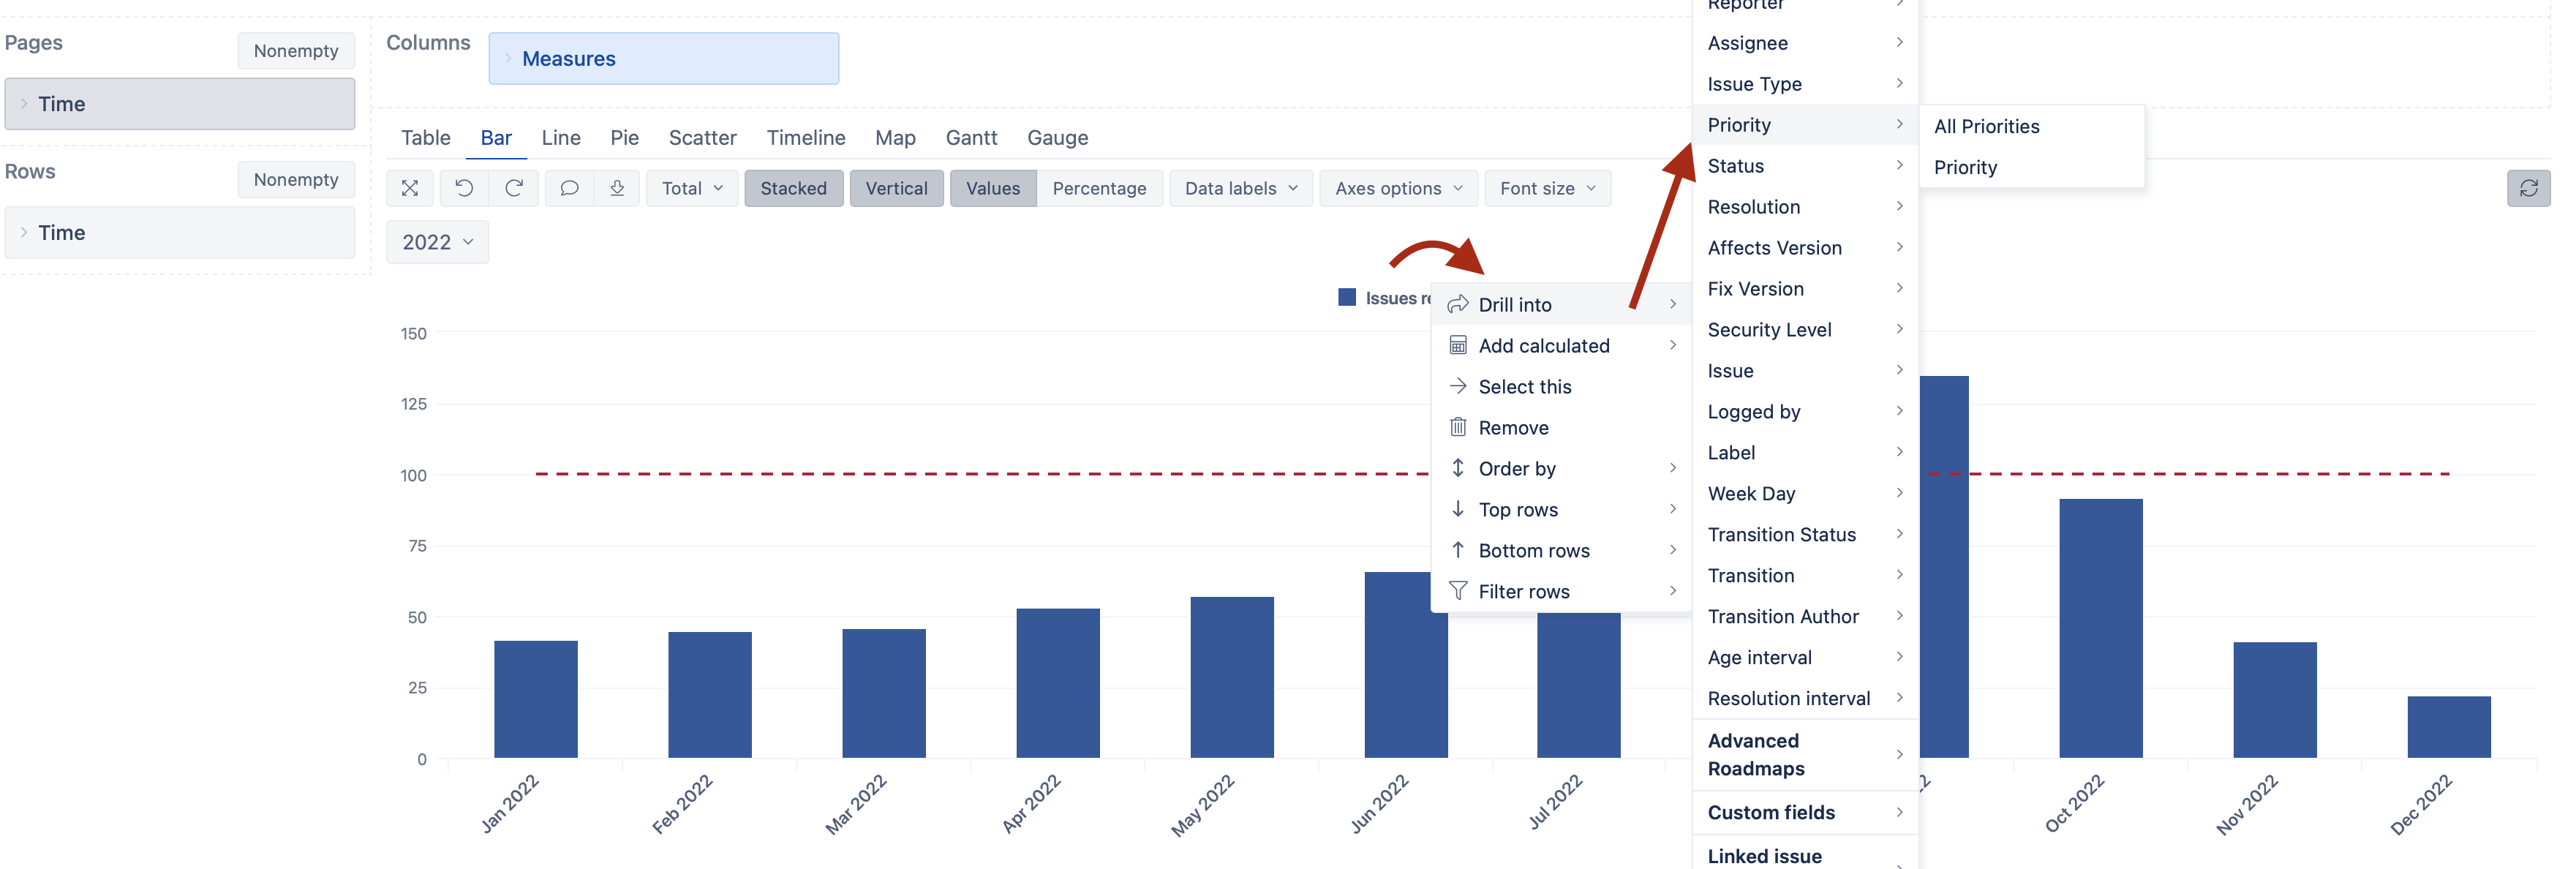
You only need the measure “Downtime Minutes” evaluated over the other dimension in columns. Once you have added the “Target” to the report, remove the other dimension from the columns. Then click on the measure “Downtime Minutes” name and select “Drill into”, then the dimension. That way, only the specific measure will take into account the dimension. See an example below:
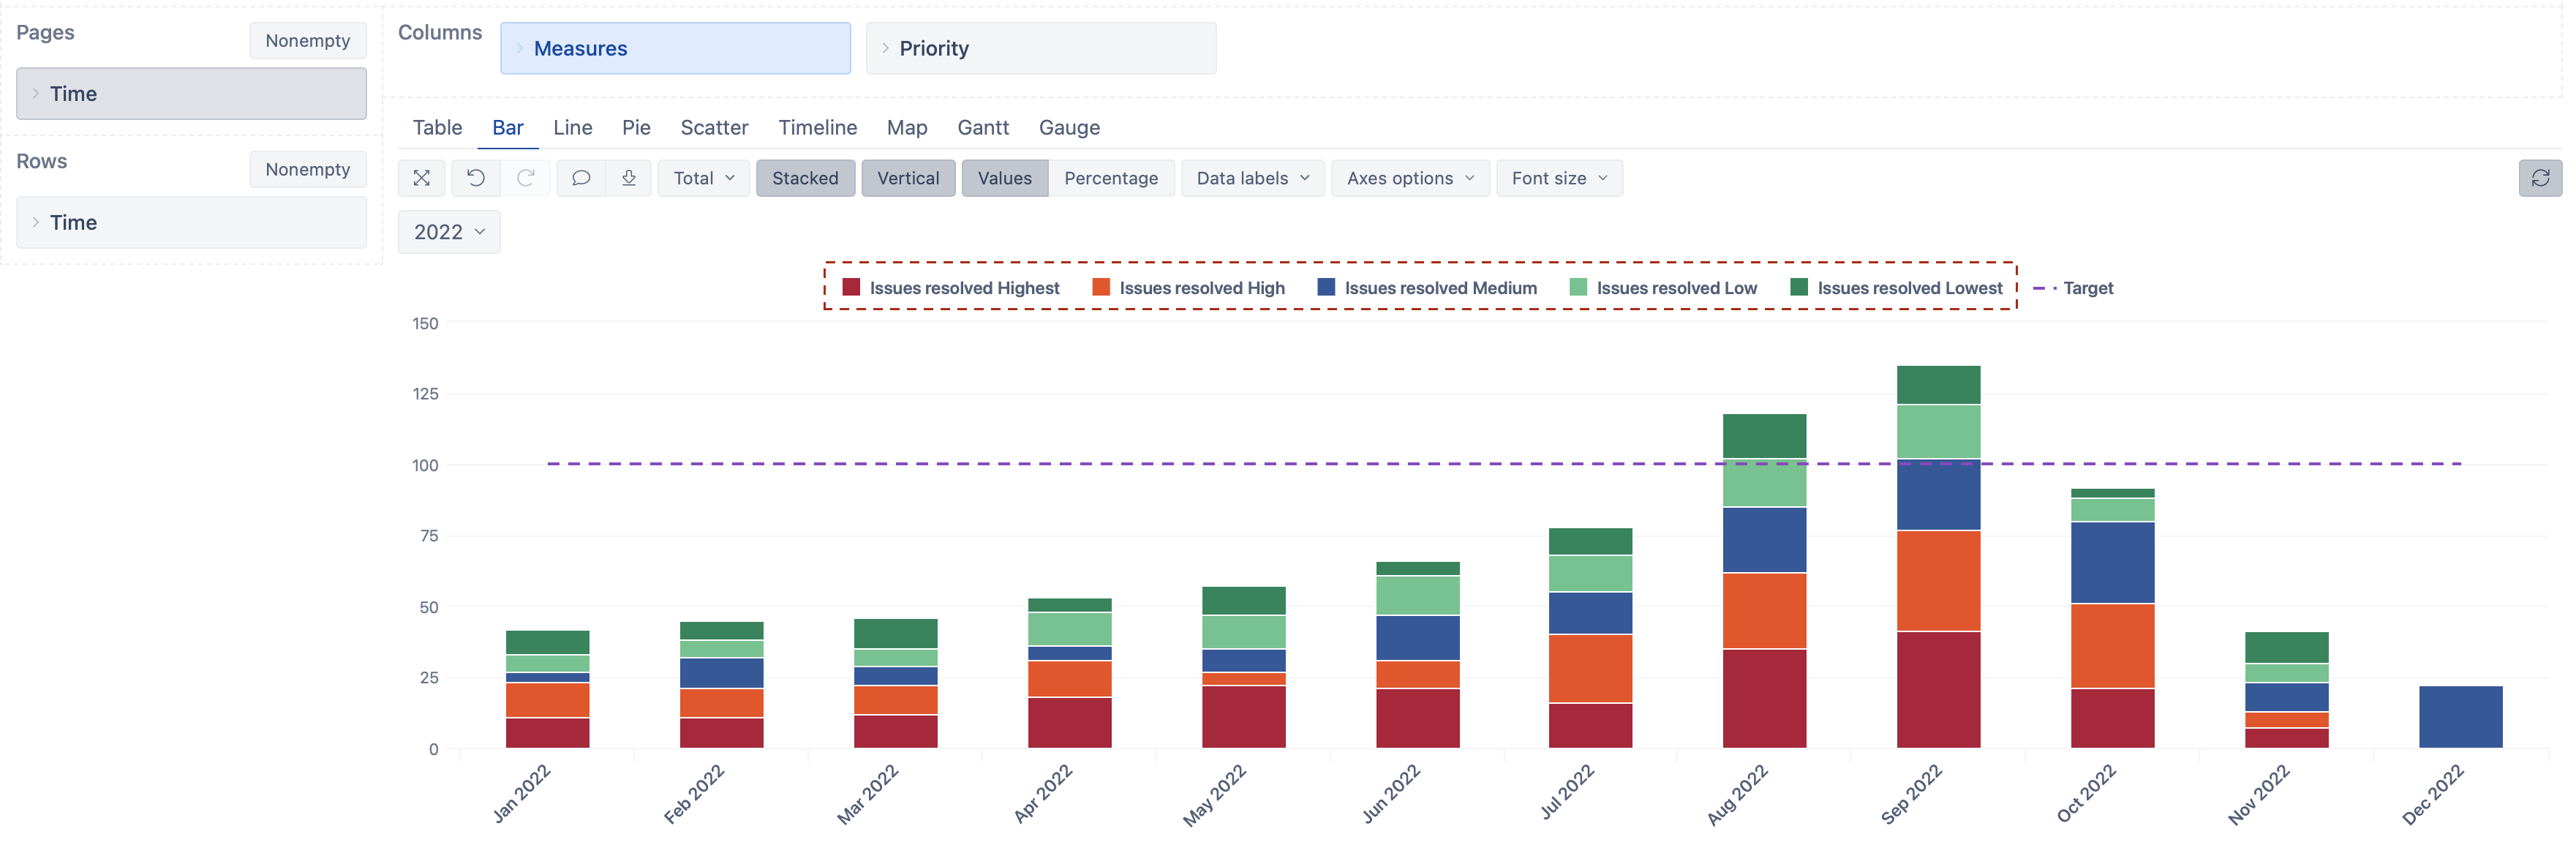
And the result:
Visit the eazyBI documentation page for more information on drilling a measure into another dimension - Create reports.
Best,
Roberts // support@eazybi.com
Ok, thanks.
What if I only need Critical and High Priority? Now it gives me either all priorities or none.
Hi @Osvalda,
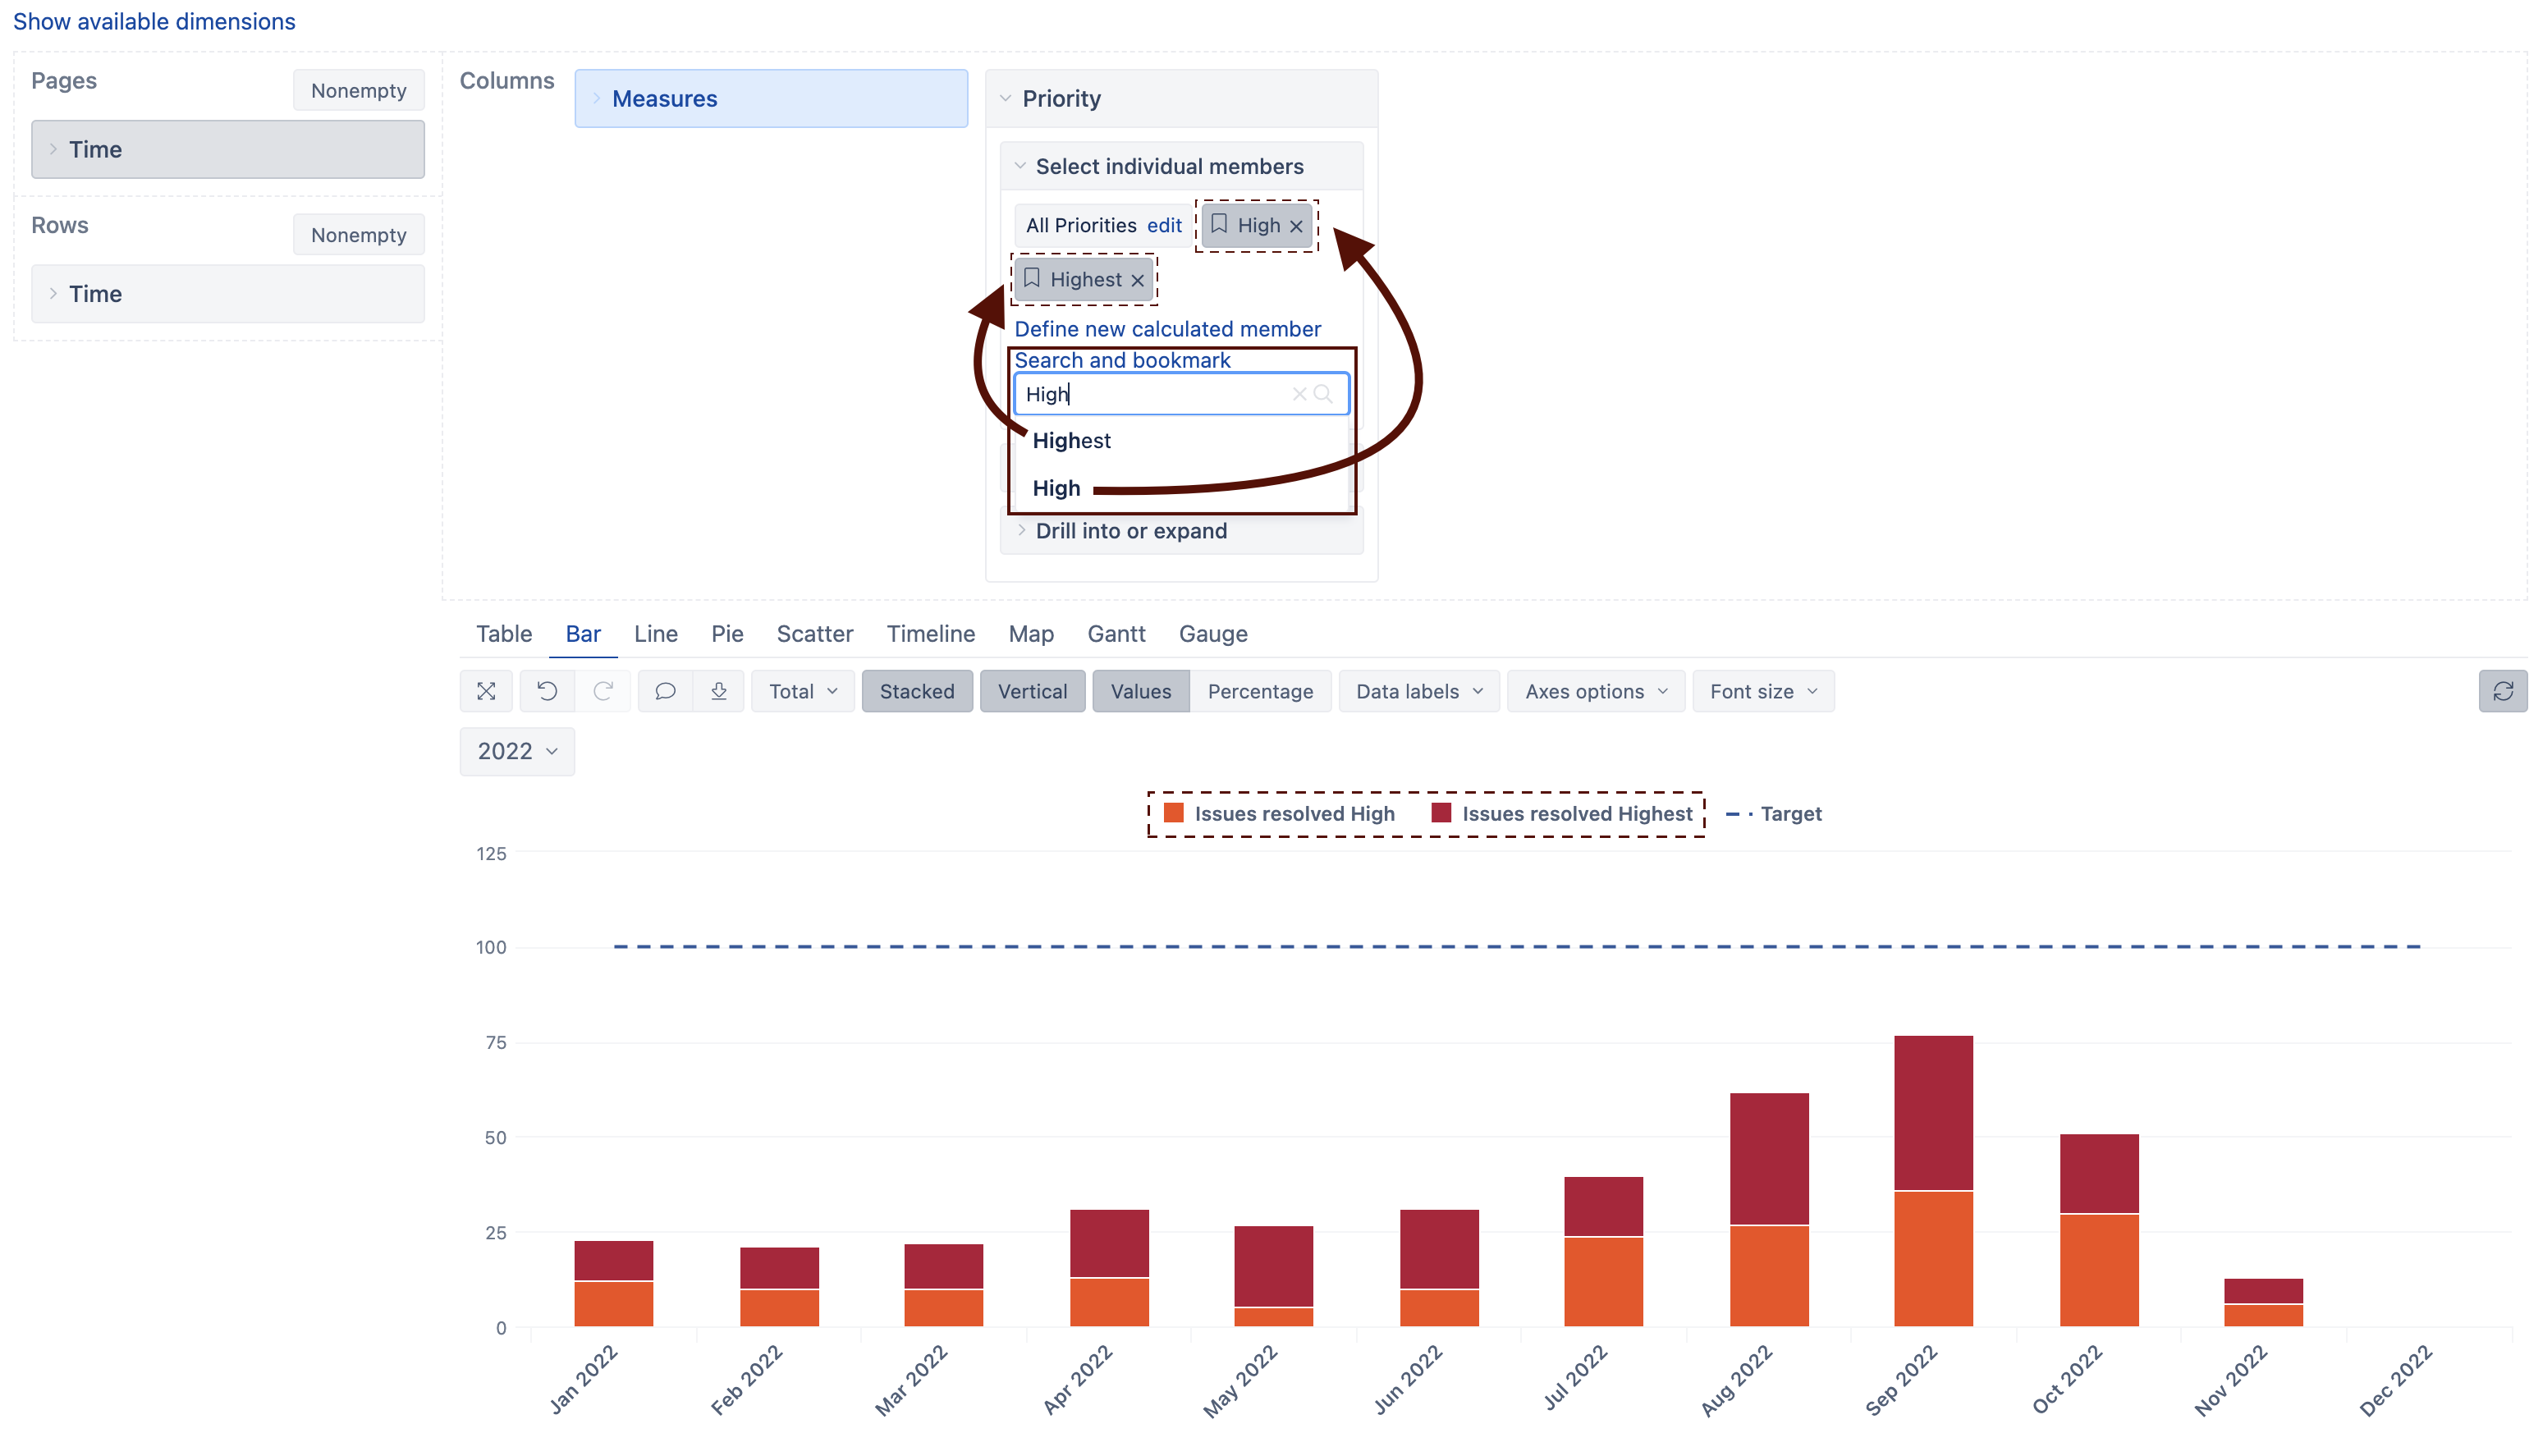
Good question! In that case, expand the Priority dimension. There search and bookmark the two members you want to display and select them. If you drilled into"All Priorities" previously, deselect it. If you drilled into individual “Priority” level members, selecting the bookmarked members is enough to display only them. See the screenshot below:
Best,
Roberts // support@eazybi.com
1 Like
Perfect! Thanks a lot ![]()
1 Like
Hi @roberts.cacus ,
I have created a calculated measure as target. but when i added to a filtered table, the target un-filtered the table. What should I do?
Thanks.
Hi @bhtan,
Please share more details about the report. What dimensions do you use, where, and how do you filter the report? Include a screenshot of the report before and after adding the target. Exporting and sharing the definition of the report could also help - Export and import report definitions.
Best,
Roberts // support@eazybi.com