Hi,
Please can I get help creating a bar chart of open Defects with Age older than 30 Days
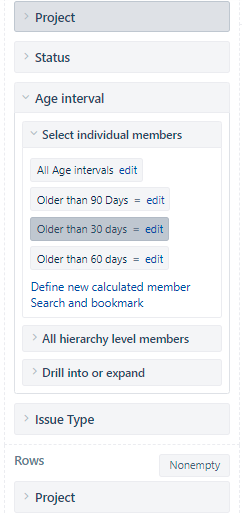
I have used Age Interval Dimension by defining a new calculated member. [Age interval].[30 - …]
[ Note i am able to create report for Age interval [Age interval].[90 - …] and not for [Age interval].[30 - …]
Correct me what is not write wrt to [Age interval].[30 - …]
Thanks
Sandeep
Hi @sandeep17382
You are on the right track with using the age interval dimension!
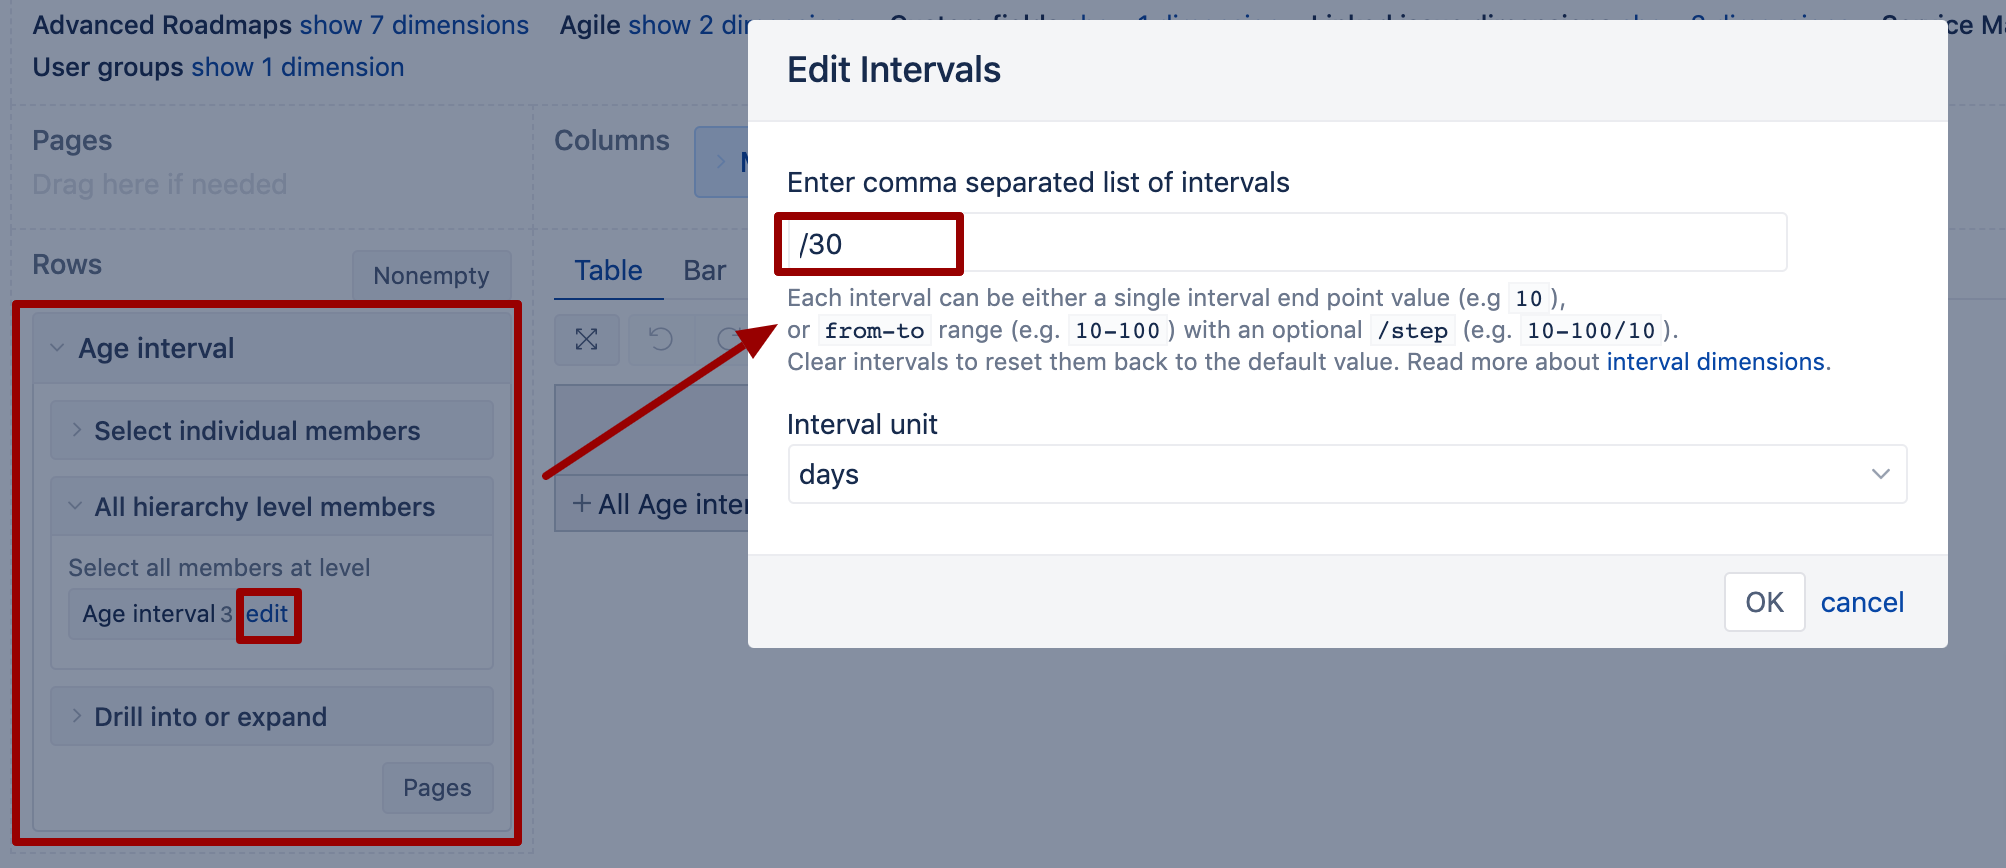
First, you may want to define and regenerate the basic intervals. Use intervals that are the smallest step in your reporting. For example, if in the report you need to group issues by “up to 30 days”, “up to 60 days”, “up to 90 days”, then intervals would be 30 days. You can regenerate basic intervals from the interval dimension, see the screenshot below:
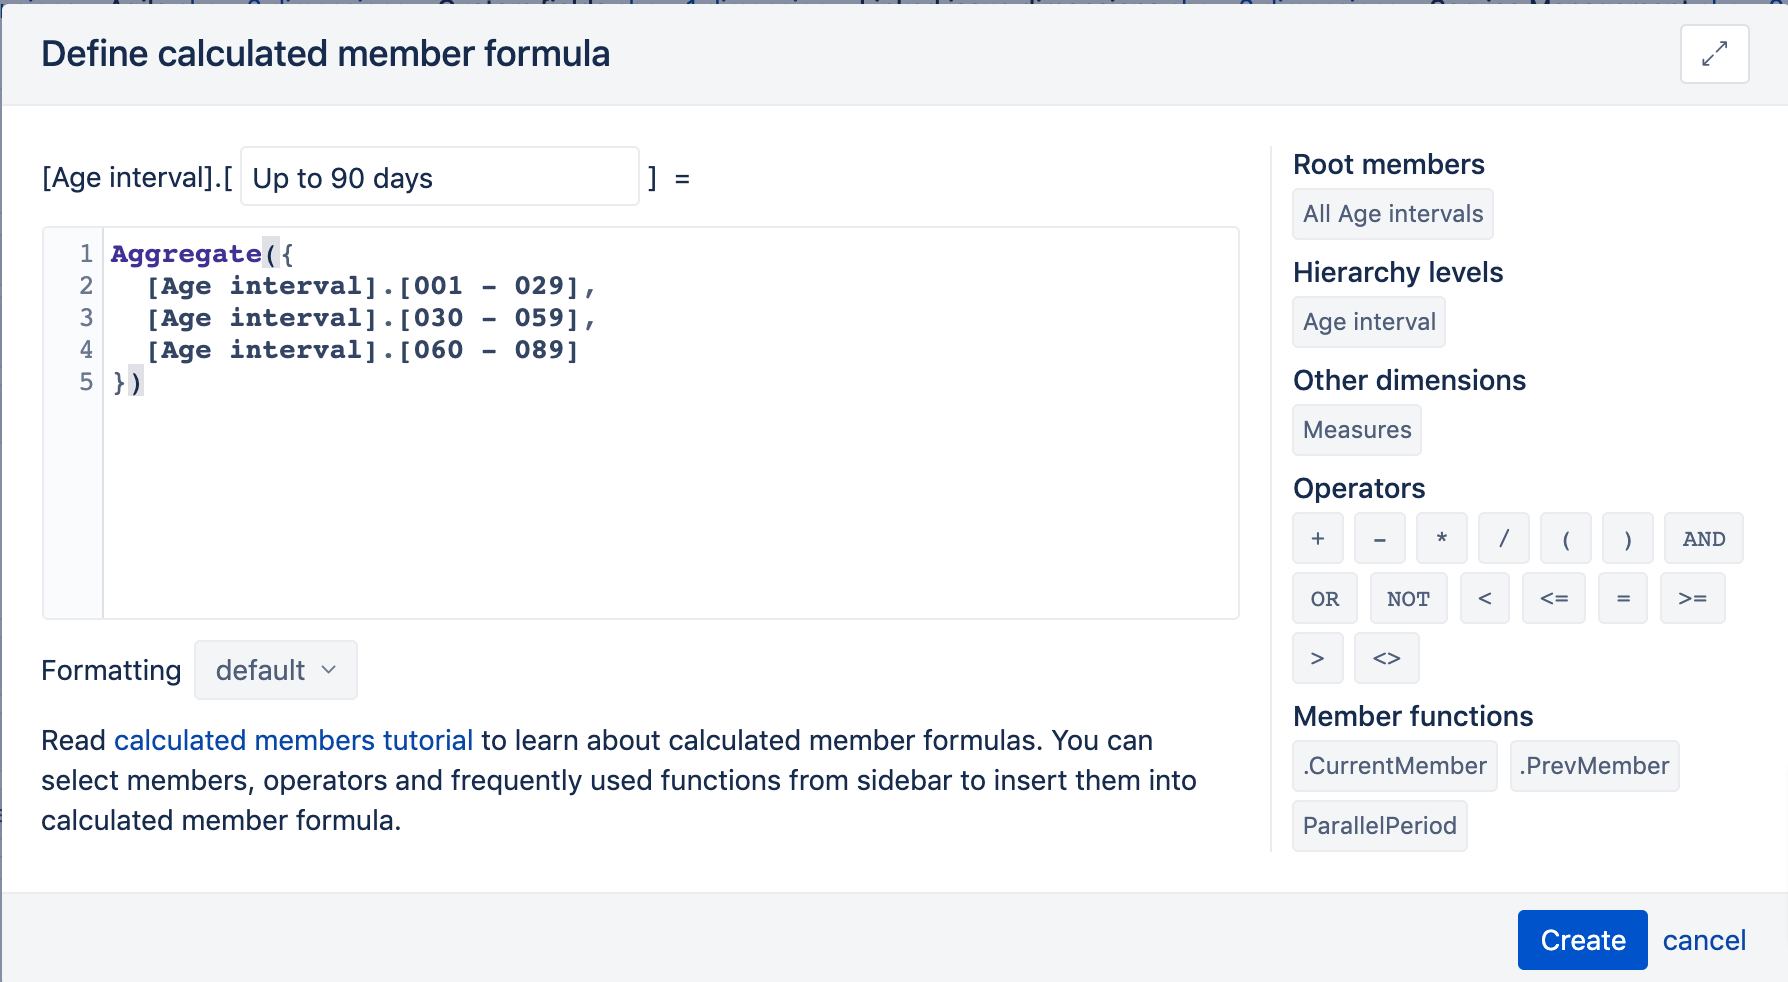
Then, create calculated members in this same Age dimension for “Up to 60 days” and “Up to 90 days” where you would combine smaller intervals to get larger.
For instance, age interval “Up to 90 days” would aggregate intervals 0-29, 30-59, and 60-89 days as in the screenshot below:
You may want to use the autocomplete function of the formula editor to select correct intervals!
Then those calculated members, used in the report, should give you valid results.
Notice that you can set up only one set of basic intervals in this dimension per account. If other reports are using this same dimension, ensure to align the intervals (for instance, use smaller intervals so you could get all reporting intervals by combining basic intervals)!
Best,
Ilze, support@eazybi.com