Need a pie chat to show the Ageing data within a specific range

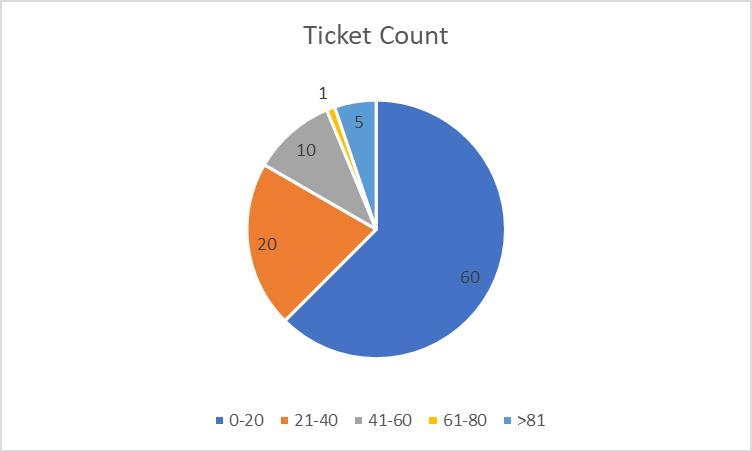
I would like to create a table with age range based on created date of the ticket. I want to use this to create a pie chart as below. Is there a simple way where I can get this done in eazyBI?

Age Range Ticket Count
0-20 60
21-40 20
41-60 10
61-80 1
>81 5

Hi @kranthi_N
You could try importing and defining age intervals:
https://docs.eazybi.com/eazybi/analyze-and-visualize/interval-dimensions

See a similar report with open issues by age intervals here:
https://eazybi.com/accounts/1000/cubes/Issues/reports/50398-unresolved-issues-by-age-interval-and-priority

Martins / eazyBI

Thanks a lot for the reply. I am able to get the report as I want. :+1: