Hi
Need assistance with a report for average working days for several Products
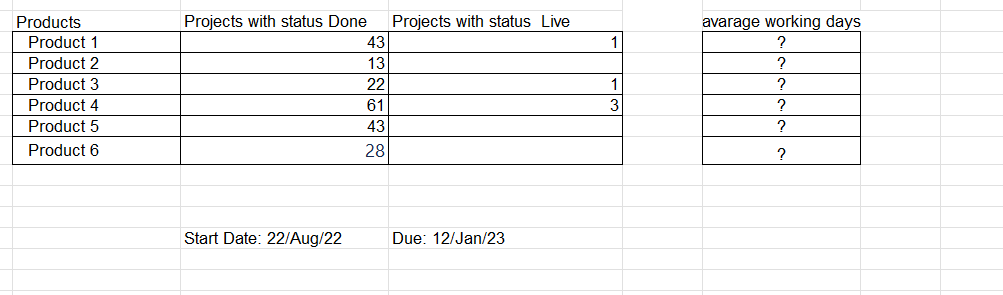
How can i create this kind of report when I have Start date, Due date and total project that are Done
| Column 1 |
Column 2 |
Column 3 |
D |
| Products |
Projects with status Done |
Projects with status Live |
avarage working days |
| Product 1 |
43 |
1 |
? |
| Product 2 |
13 |
|
? |
| Product 3 |
22 |
1 |
? |
| Product 4 |
61 |
3 |
? |
| Product 5 |
43 |
|
? |
| Product 6 |
28 |
|
? |
|
|
|
|
|
|
|
|
| Thanks in advance |
|
|
|
Hi @Coachen
Thanks for posting your question!
Based on your use case, I recommend trying eazyBI standard measure “Average Resolution Workdays” and checking if that returns the expected results.
To count the “Projects” (I am assuming these are Issues) with Done and Live statuses, try defining two calculated measures (Calculated measures and members) with Tuple (Tuple) functions as below:
For Issues with status “Done”:
( [Measures].[Issues created],
 [Status].[Done] )
For issues with Status “Live”:
( [Measures].[Issues created],
[Status].[Live] )
If this doesnt meet your expectations from the report, please:
- make a screenshot of the faulty eazyBI report and highlight the problem area
and
- export and share the definition for your eazyBI report and send it to support@eazybi.com referring to this community post.
Export and import report definitions
Best wishes,
Elita from support@eazybi.com
Hi
I will send the information to your support adress
Thanks