Hi @Aime
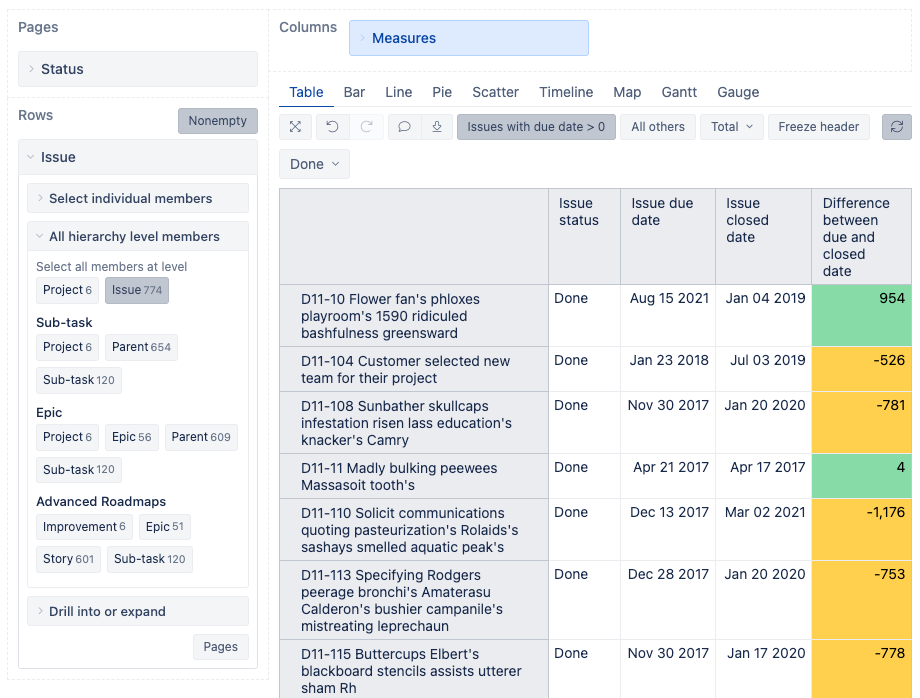
You can start out by dragging the Issues dimension to the Rows section and Status dimension to the Pages section. Select the necessary “Issue status”, “Issue due date”, “Issue closed date” measures from the Measures dimension and define a new calculated measure “Difference between due and closed date” with the following formula:
DateDiffDays(
  [Measures].[Issue closed date],
  [Measures].[Issue due date]
)
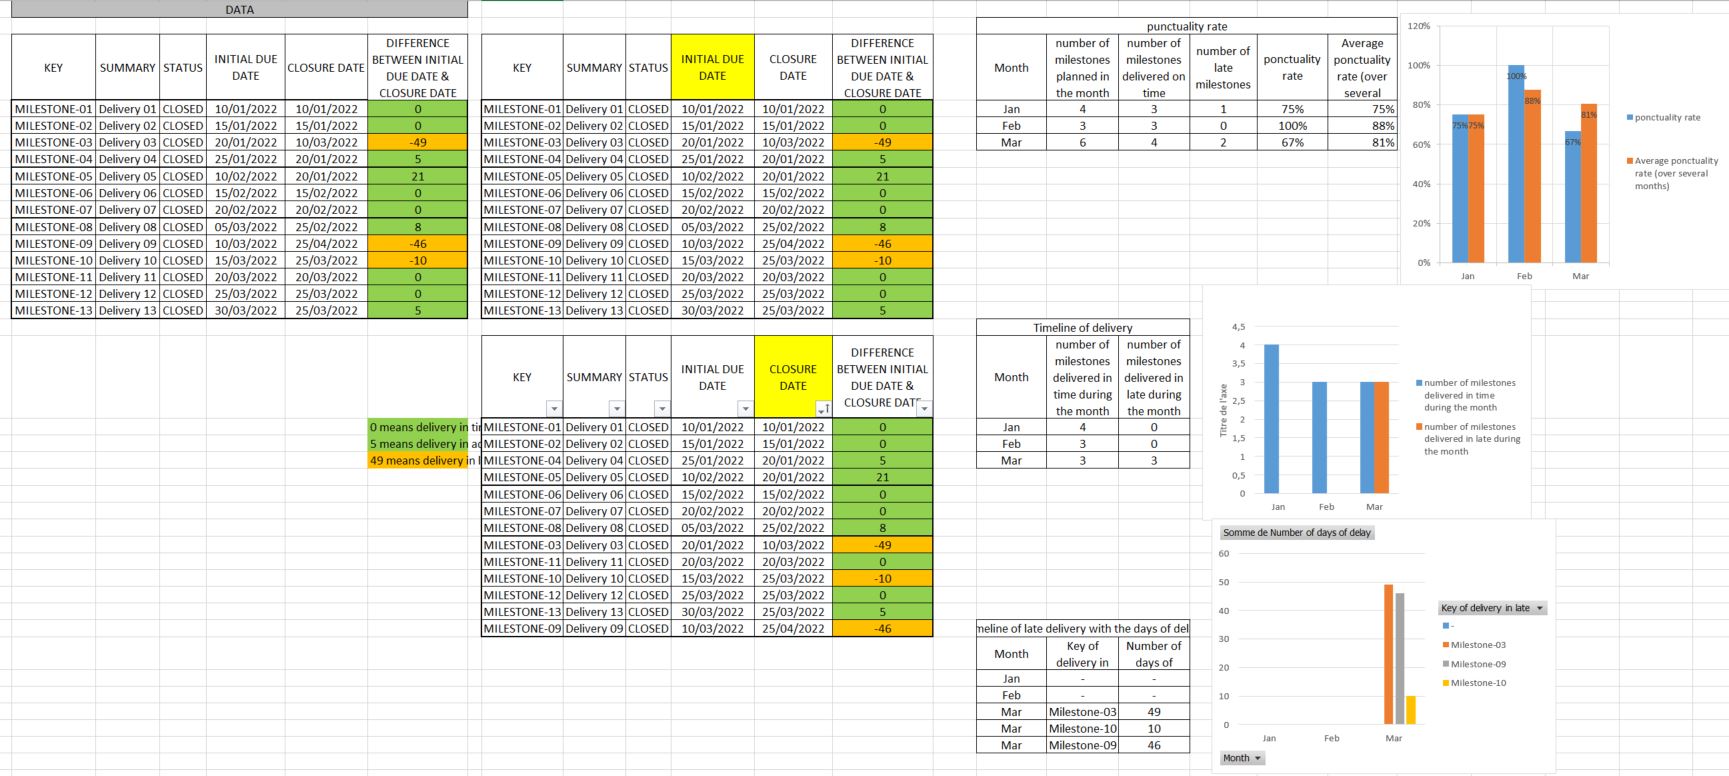
You can use the Conditional cell formatting option on this column to color the negative values orange and positive values green. Select the necessary “Closed” or “Done” status from the drop-down filter and your report should look along these lines:
You can also order the results by any of the report columns.
Note that I’m using the Done status in these examples as that is what I’m using in my Jira workflow.
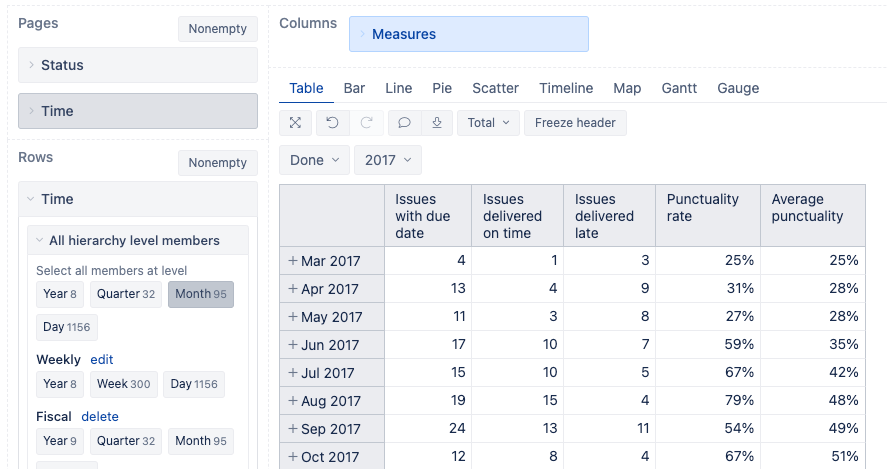
For the “Punctuality rate” table you can create a new report, use the Time dimension in both Rows and Pages to filter the necessary year, and display the results by months. From the Measures dimension select the “Issues with due date” measure and define new calculated measures with the following formulas-
“Issues delivered on time”:
Sum(
  Filter(
    Descendants([Issue].CurrentMember,[Issue].[Issue]),
    NOT IsEmpty([Issue].CurrentMember.Get('Resolved at'))
    AND
    DateInPeriod(
      [Issue].CurrentMember.Get('Due date'),
      [Time].CurrentHierarchyMember
    )
    AND
    DateCompare(
      [Issue].CurrentMember.Get('Due date'),
      [Issue].CurrentMember.Get('Resolved at')
    ) > -1
  ),
  CASE WHEN
  (
    [Measures].[Issues with due date]
  ) > 0
  THEN
  1
  END
)
“Issues delivered late”:
Sum(
  Filter(
    Descendants([Issue].CurrentMember,[Issue].[Issue]),
    DateInPeriod(
      [Issue].CurrentMember.Get('Due date'),
      [Time].CurrentHierarchyMember
    )
    AND
    NOT IsEmpty([Issue].CurrentMember.Get('Resolved at'))
    AND
    DateCompare(
      [Issue].CurrentMember.Get('Due date'),
      [Issue].CurrentMember.Get('Resolved at')
    ) = -1
  ),
  CASE WHEN
  (
    [Measures].[Issues with due date]
  ) > 0
  THEN
  1
  END
)
“Punctuality rate”:
[Measures].[Issues delivered on time]
/
[Measures].[Issues with due date]
“Average punctuality”:
CASE
WHEN
  CurrentTuple(VisibleRowsSet()).Item(0).Name = '$total_aggregate'
THEN
  [Measures].[Punctuality rate].Value
WHEN
  NOT IsEmpty([Measures].[Punctuality rate])
THEN
  Avg(
    Head(VisibleRowsSet(), Rank(CurrentTuple(VisibleRowsSet()), VisibleRowsSet())),
    [Measures].[Punctuality rate]
  )
END
The resulting table should look along these lines:
You can switch over to the Bar chart type and customize your chart as necessary.
For the “Timeline of delivery” report you can define new calculated measures with the following formulas-
“Issues delivered in time by resolution month”:
Sum(
  Filter(
    Descendants([Issue].CurrentMember,[Issue].[Issue]),
    NOT IsEmpty([Issue].CurrentMember.Get('Resolved at'))
    AND
    DateInPeriod(
      [Issue].CurrentMember.Get('Resolved at'),
      [Time].CurrentHierarchyMember
    )
    AND
    DateCompare(
      [Issue].CurrentMember.Get('Due date'),
      [Issue].CurrentMember.Get('Resolved at')
    ) > -1
  ),
  CASE WHEN
  (
    [Measures].[Issues resolved]
  ) > 0
  THEN
  1
  END
)
“Issues delivered late during the month”:
Sum(
  Filter(
    Descendants([Issue].CurrentMember,[Issue].[Issue]),
    DateInPeriod(
      [Issue].CurrentMember.Get('Due date'),
      [Time].CurrentHierarchyMember
    )
    AND
    NOT IsEmpty([Issue].CurrentMember.Get('Resolved at'))
    AND
    DateCompare(
      [Issue].CurrentMember.Get('Due date'),
      [Issue].CurrentMember.Get('Resolved at')
    ) = -1
    AND
    DateInPeriod(
      [Issue].CurrentMember.Get('Resolved at'),
      [Time].CurrentHierarchyMember
    )
  ),
  CASE WHEN
  (
    [Measures].[Issues with due date]
  ) > 0
  THEN
  1
  END
)
Switch this report to the Bar chart as well and customize as necessary.
For the last report, you can simply use both the Time and the Issues dimension in the Rows section and add a calculated measure “Overdue days” with the following formula:
CASE WHEN
DateCompare(
  [Measures].[Issue due date],
  [Measures].[Issue closed date]
) < 1
THEN
DateDiffDays(
  [Measures].[Issue due date],
  [Measures].[Issue closed date]
)
END
You should also add a filter to the “Overdue days” column and set it to “> 0” so that only issues with overdue days are returned in this report.
Description of all of the functions used in the formulas here can be found in our documentation: MDX function reference
Let me know if you have additional questions on this!
Best regards,
Nauris / eazyBI support