Hi everyone!
I would like to clarify one point, which concerns the sorting of date and time values. Why do some lines on my chart correctly show the date of the ascending sorting and others not?
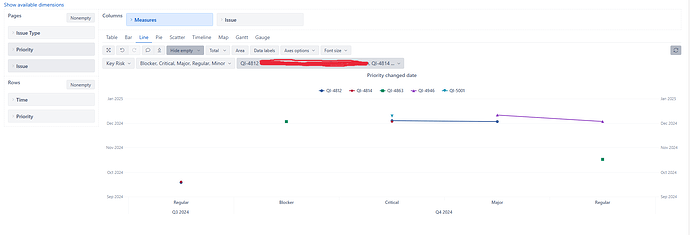
I use ascending sorting for one of the lines - in this screenshot on the green line I chose order by ascending:
As you can see, the QI-4946 purple line shows the date of the change in priority of the task to fall, first goes 11 December 2024 and then 3 December 2024, although it should be the other way around.
The situation of QI-4812 is a little more interesting - it first shows correct dates starting from 18 September 2024, then increases to 4 December 2024 and ends on 3 December 2024. Why first goes 4 decab, and then 3 puzzle for me.
This situation occurs if I use order by ascending QI-4863.
Here I have removed any sort and by some mysterious reason for me I have the whole chart and the points do not connect lines for green, red and blue task (only two of them), left only for purple =)
@janis.plume maybe you could help me?
Please explain me how to save lines and at the same time make all their dates ascending?
Best regards,
Agreg


