Hi all, in need of some help…
I am trying to create labels based on custom labels, i.e., OUS and US. Which i can do with no problem. But the tricky part is this, from those labels, I’m trying to dig deep by saying, "Okay, from OUS, show me all labels that contain iOS in them. Same thing for US and iOS, OUS and Android, and OUS and iOS.
For example, i have a list of all issues within OUS, but to further break it down i want to see from that list how many of them are from US and OUS and separate which one with a pie chart.
I hope this makes sense. Any help would be much appreciated
Hi @Bhavikc20
Welcome to the Community! 
Are all of these labels kept within the default Jira Label field?
If so, then you can add the following code to your Advanced settings to define a new custom field dimension “OUS/US Labels” that will then be able to use in your reports as a Page filter to filter out OUS or US labeled issues:
[jira.customfield_oususlabels]
name = "OUS/US Labels"
data_type = "string"
dimension = true
javascript_code = '''
if (issue.fields.labels.length > 0) {
    if (issue.fields.labels.indexOf("OUS")!=-1)) {
        issue.fields.customfield_oususlabels = "OUS Label";
    } else if (issue.fields.indexOf("US")!=-1)) {
        issue.fields.customfield_oususlabels = "US Label";
    }
}
'''
Save the Advanced settings, go to your “Source Data” tab → “Edit” → “Custom fields”, select this “OUS/US Labels” field to be imported as a dimension, and start the Import.
After the import finishes, this dimension should be available in the report creation view in the Dimension → Custom fields section.
Note that this code assumes that an issue cannot have both “OUS” and the “US” labels simultaneously. If this is a possibility, you can change the Javascript code to account for this as well.
Let me know if you have any additional questions on this!
Best regards,
Nauris / eazyBI support
HI Nauris,
That is correct all labels are in a customer field.
I was wondering is there is anything easier. I know Nara (another dashabord platform) has this feature were you can do it within the dashboard rather than doing so and creating javascripts and importing etc
Hi @Bhavikc20
You can define two new calculated measures in the Measures dimension, one for each of the “OUS” and “US” labels with a formula like this:
Sum(
  Filter(
    Descendants([Issue].CurrentMember,[Issue].[Issue]),
    (
      [Measures].[Issues created],
      [Label].[OUS]
    ) > 0
  ),
  CASE WHEN
  [Measures].[Issues created] > 0
  THEN
  1
  END
)
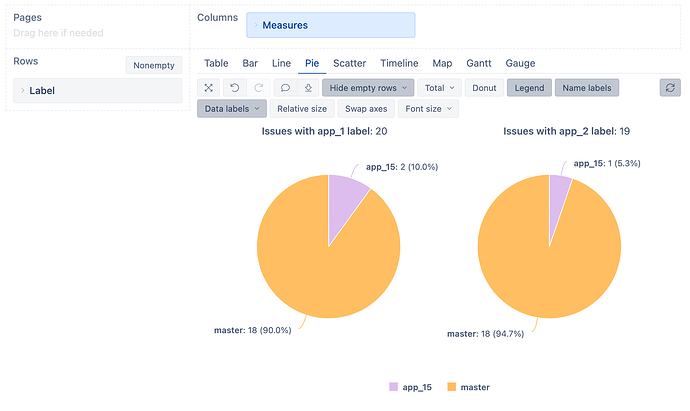
Next, you can use these two measures in a report together with the Labels dimension to see how these labels are divided across other labels:
Best regards,
Nauris
