Hello EazyBI Community,
I have created a customized chart for sprint health which takes the commitment numbers (count) after adding 1 day slack. Idea is to give teams 1 entire day to wrap up their planning. So commitment in terms of Issue Count & Story Points is being calculated using a user defined calculated measure which considers Sprint start date + 1 day.
I have following columns in my table: Issues committed, Sprint Issues Completed, Sprint Issues not completed, Sprint Commitment Changes (Count) & % Sprint Health.
I need to split the calculated measure that I created for Sprint commitment changes (count) into 2 columns Issues Added (count) & Issues Removed (count) & the summation of both should be equal to the main column i.e. Sprint commitment changes.
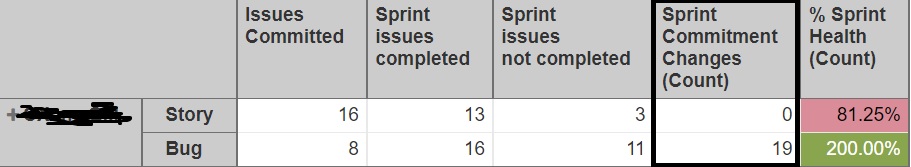
In the above example, when I drill down into story - I see 2 issues were added & then 2 issues were removed & hence the count is 0, which is fine. Now I want to split this into 2 columns Issues Added & Issues Removed which should show the same data i.e. 2 in Issues Added & 2 in Issues Removed.
Issues Committed:
–Count of Issues on sprint start + 1 day slack
(
[Measures].[Issues history],
[Time].CurrentHierarchy.Levels(‘Day’).DateMember(
DateAddDays(
[Sprint].CurrentMember.get(‘Start date’),1
)
)
)
Sprint Commitment changes(count):
[Measures].[Sprint issues at closing] -
[Measures].[Issues Committed]
Requesting help in this case. Thanks in advance.
