I have a manual report that I want to build in EazyBi.
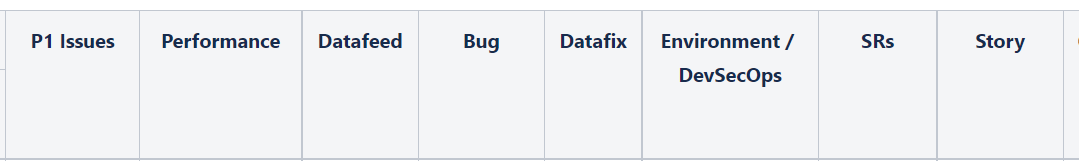
The report looks like:
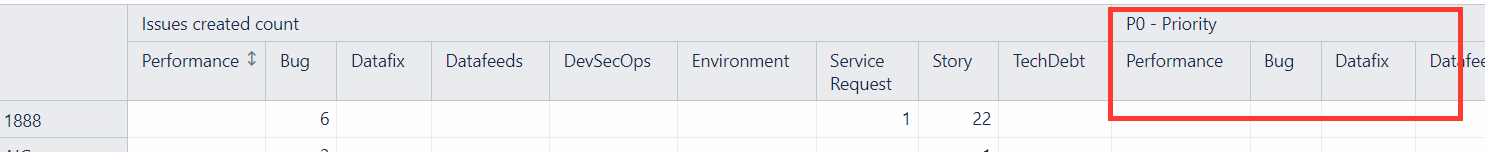
Now I could get the issuetypes, and I created a measure of P0 as well & used it, but it gives me a report as below, instead of what I want.
In that column of Priority I want the total, instead of issuetype breakup.
Have defined my measure as below:
([Measures].[Issues created],
[Priority].[P0]
)
What can I do additional to get what I am looking for?
Thanks!
Hi Prathima,
You were correct with the creation of a calculated measure.
The following steps for the desired look of the table would be following:
- remove the Issue Type dimension from columns
- Drill into the measure you would like to expand to the level that you would like to display
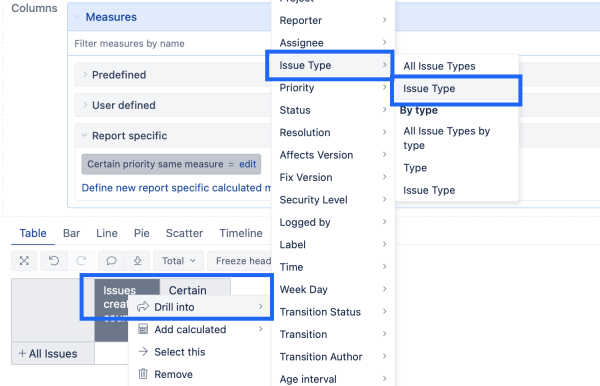
Now you should have something similar to this:
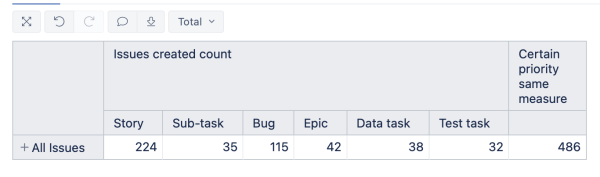
You may drag the “calculated measure” to the left to achieve precisely the same look as the manual report.
You can find more about this in our documentation here: Create reports.
Please let me know if this works for you.
Kind regards,
Oskars / support@eazybi.com
1 Like
Thanks Oskars. This totally did it for me… Got the report in the format I wanted. Perfect.