Hello, I am quite new using easyBI, and I get lost trying to manipulate the status of my issues. I just want to see how many issues per status for each month. But if using status dimension next to the created issues measure, then I see that the count is not good. Some issues are missing in the table per status
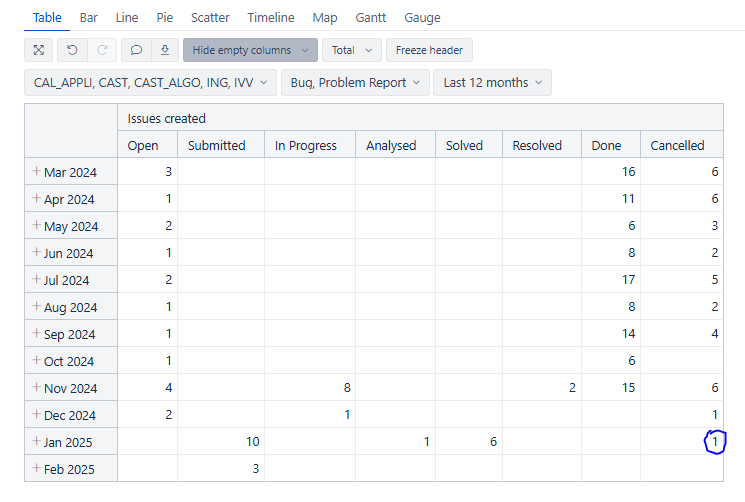
The blue number should be 5. 5 issues (Bug and Problem reports) moved to CANCELLED in january.
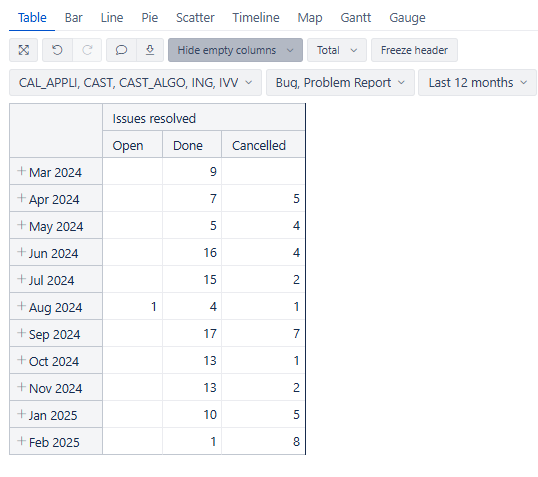
I can use “issue resolved” measure, but then I don’t have the Open, In Progress… other status
Any help to get the number of tickets per status per months for every status ? And to understand why I don’t get the same results for the resolved status?
Since your report uses the ‘Issues created’ measure, the number in the blue circle represents issues that were created in January, match all page filters, and are currently in the ‘Cancelled’ status.
In eazyBI there is only one Time dimension and each measure has a specific relationship with it, for example:
Issues created measure shows issues created within the selected time period. For example, if you select January 2024, it will show issues with creation dates in January.
Issues resolved measure shows issues resolved within the selected time period. If you select January 2024, it shows issues with resolution dates in January (regardless of when they were created).
Open issues measure shows the number of unresolved issues at the end of the selected time period. For January 2024, it shows issues that were still open on January 31st.
To count how many issues were moved to a specific status in a given month, ensure that issue change history is imported.
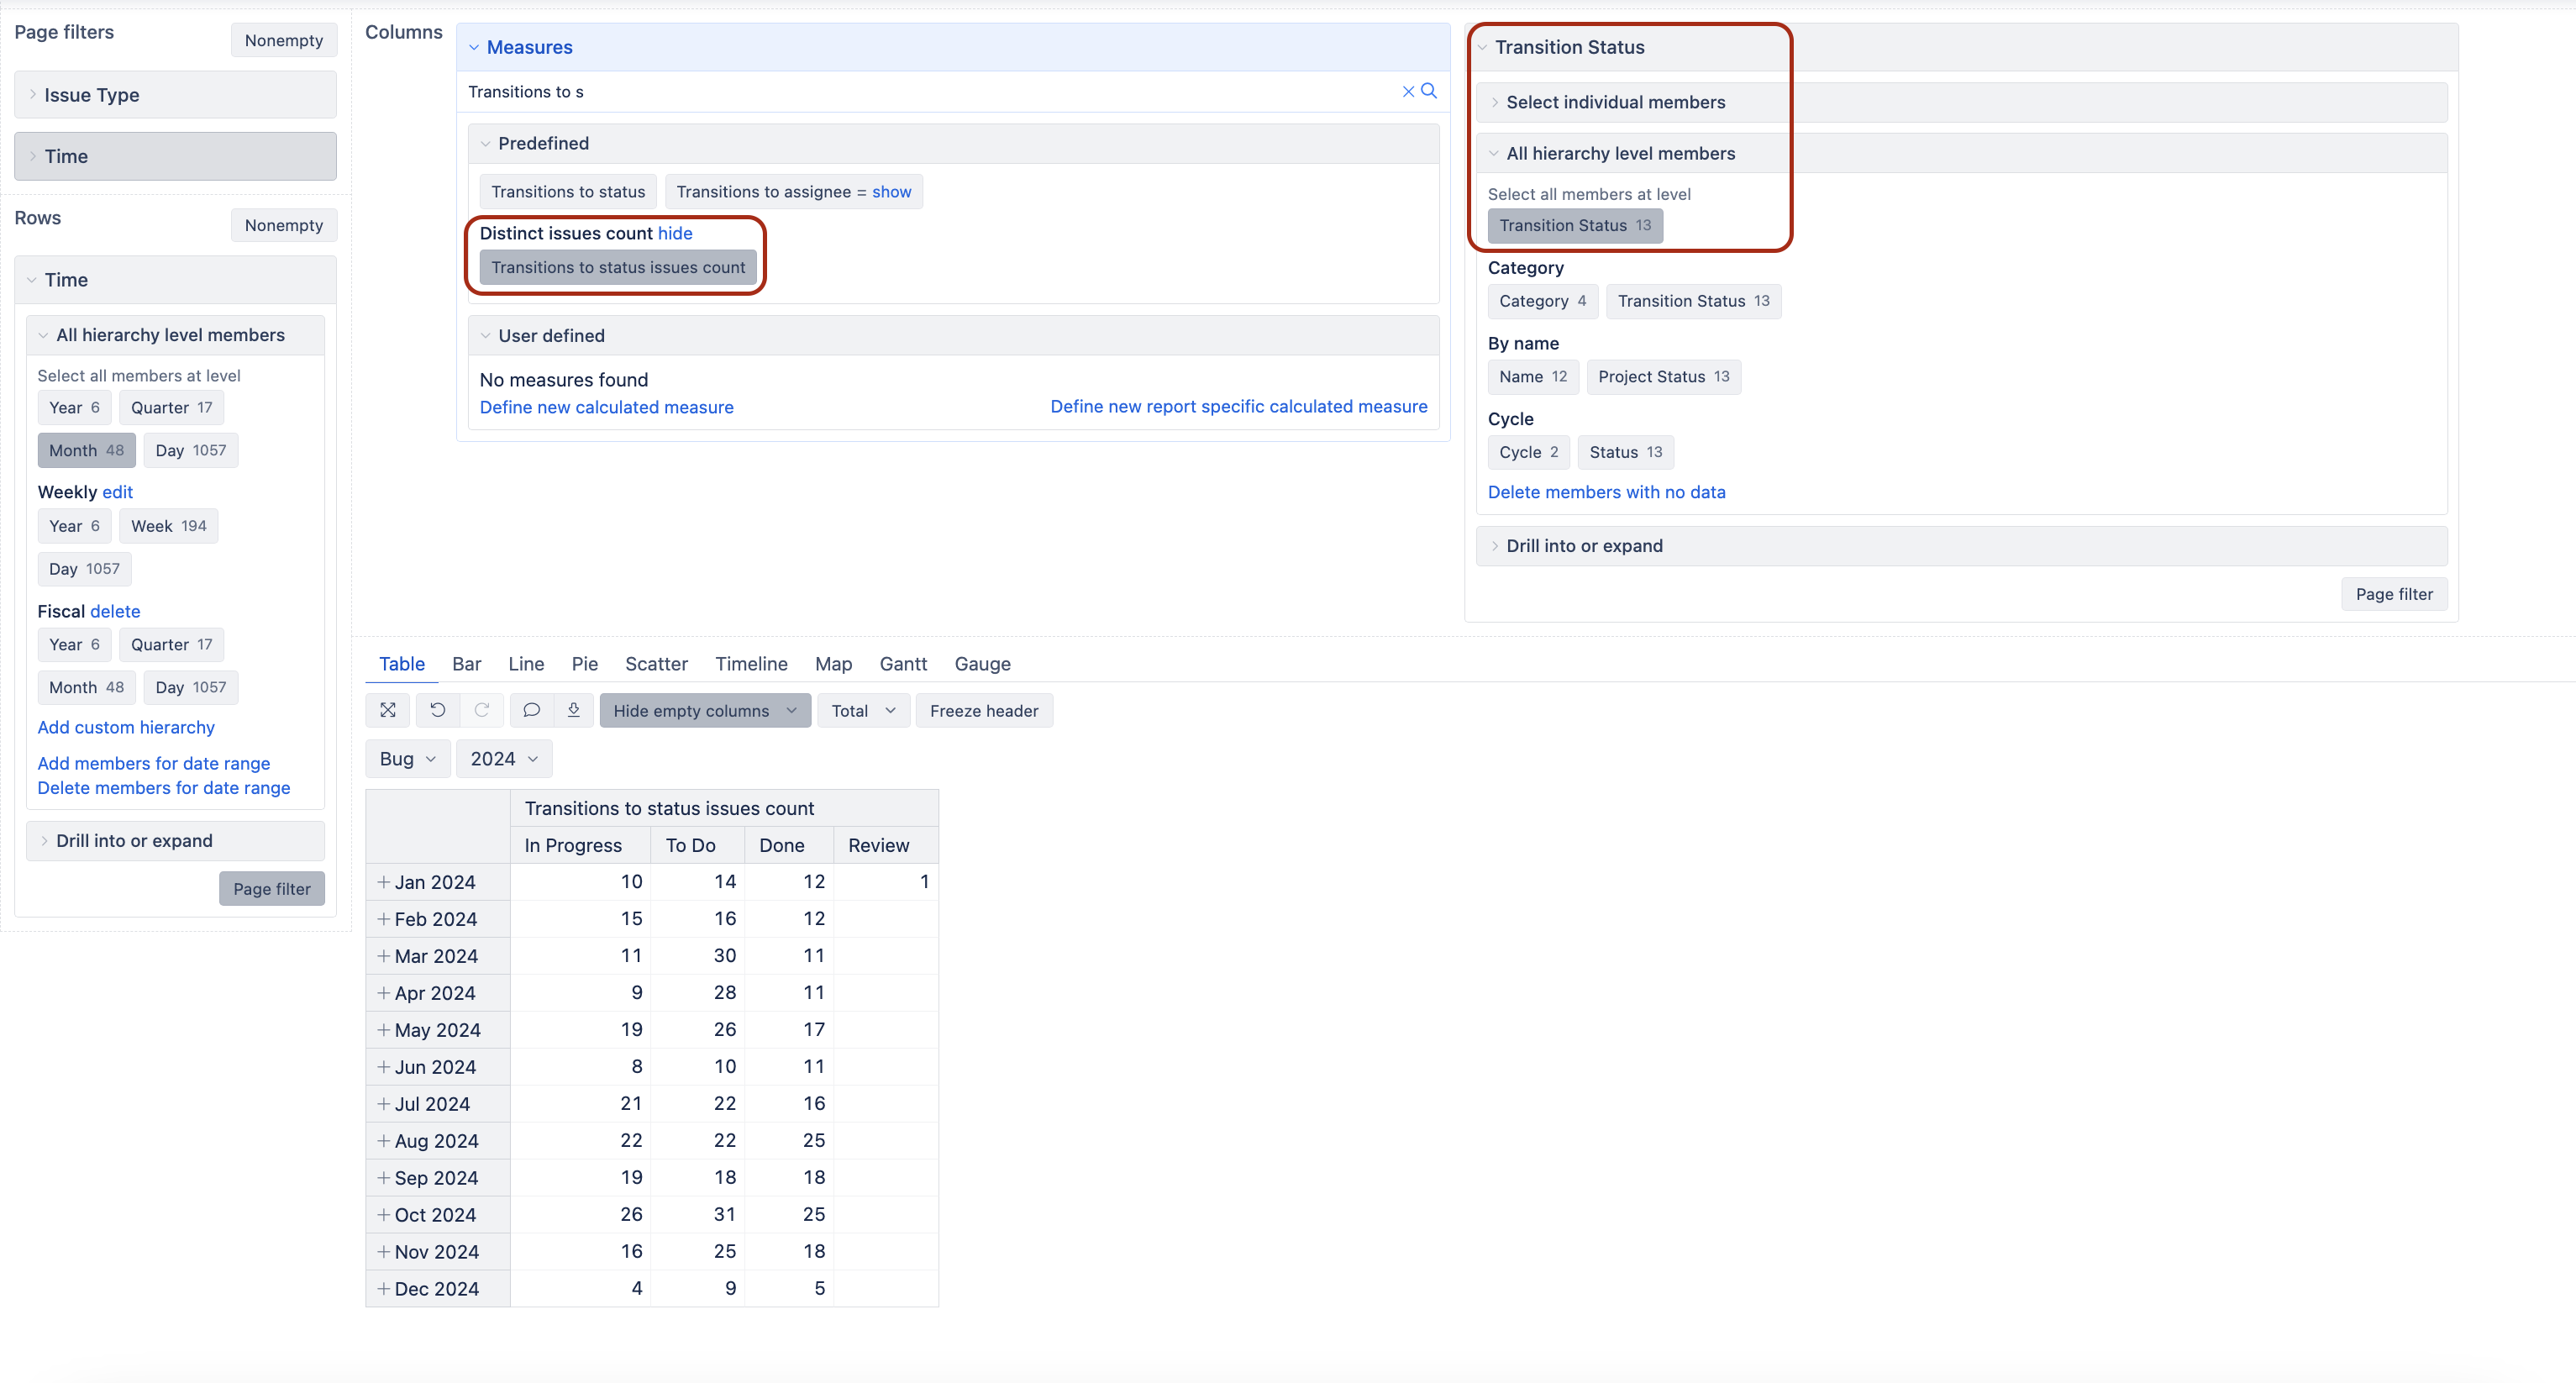
If the issue change history is available, use dimension ‘Transition Status’ instead of the ‘Status’ dimension in the columns. Then use the ‘Transitions to status issues count’ measure to see the number of issues that transitioned to each status within given month.
For example: