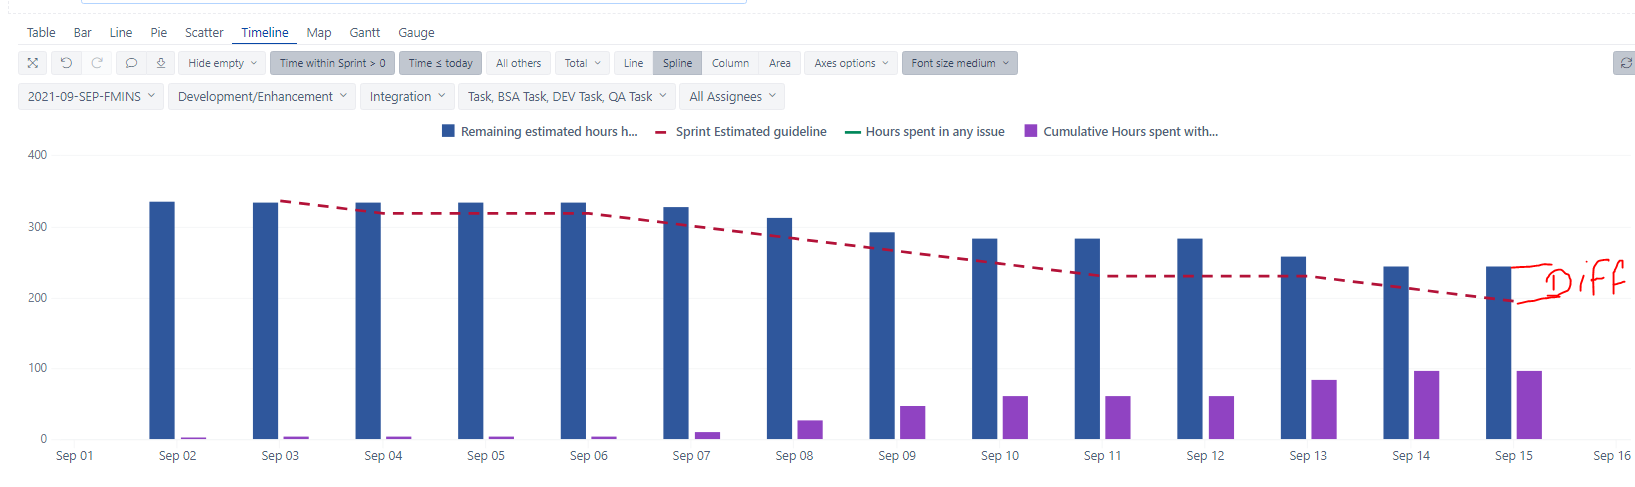
Is there a way we can find the difference the guideline Number - Remaining estimate number when we hover over for each day.
Hi!
You may create a new measure (in measures) that calculates the arithmetical difference between measures “Sprint Estimated guideline” and “Remaining estimated hours history”, and then add this measure to the report and put it on a separate axis.
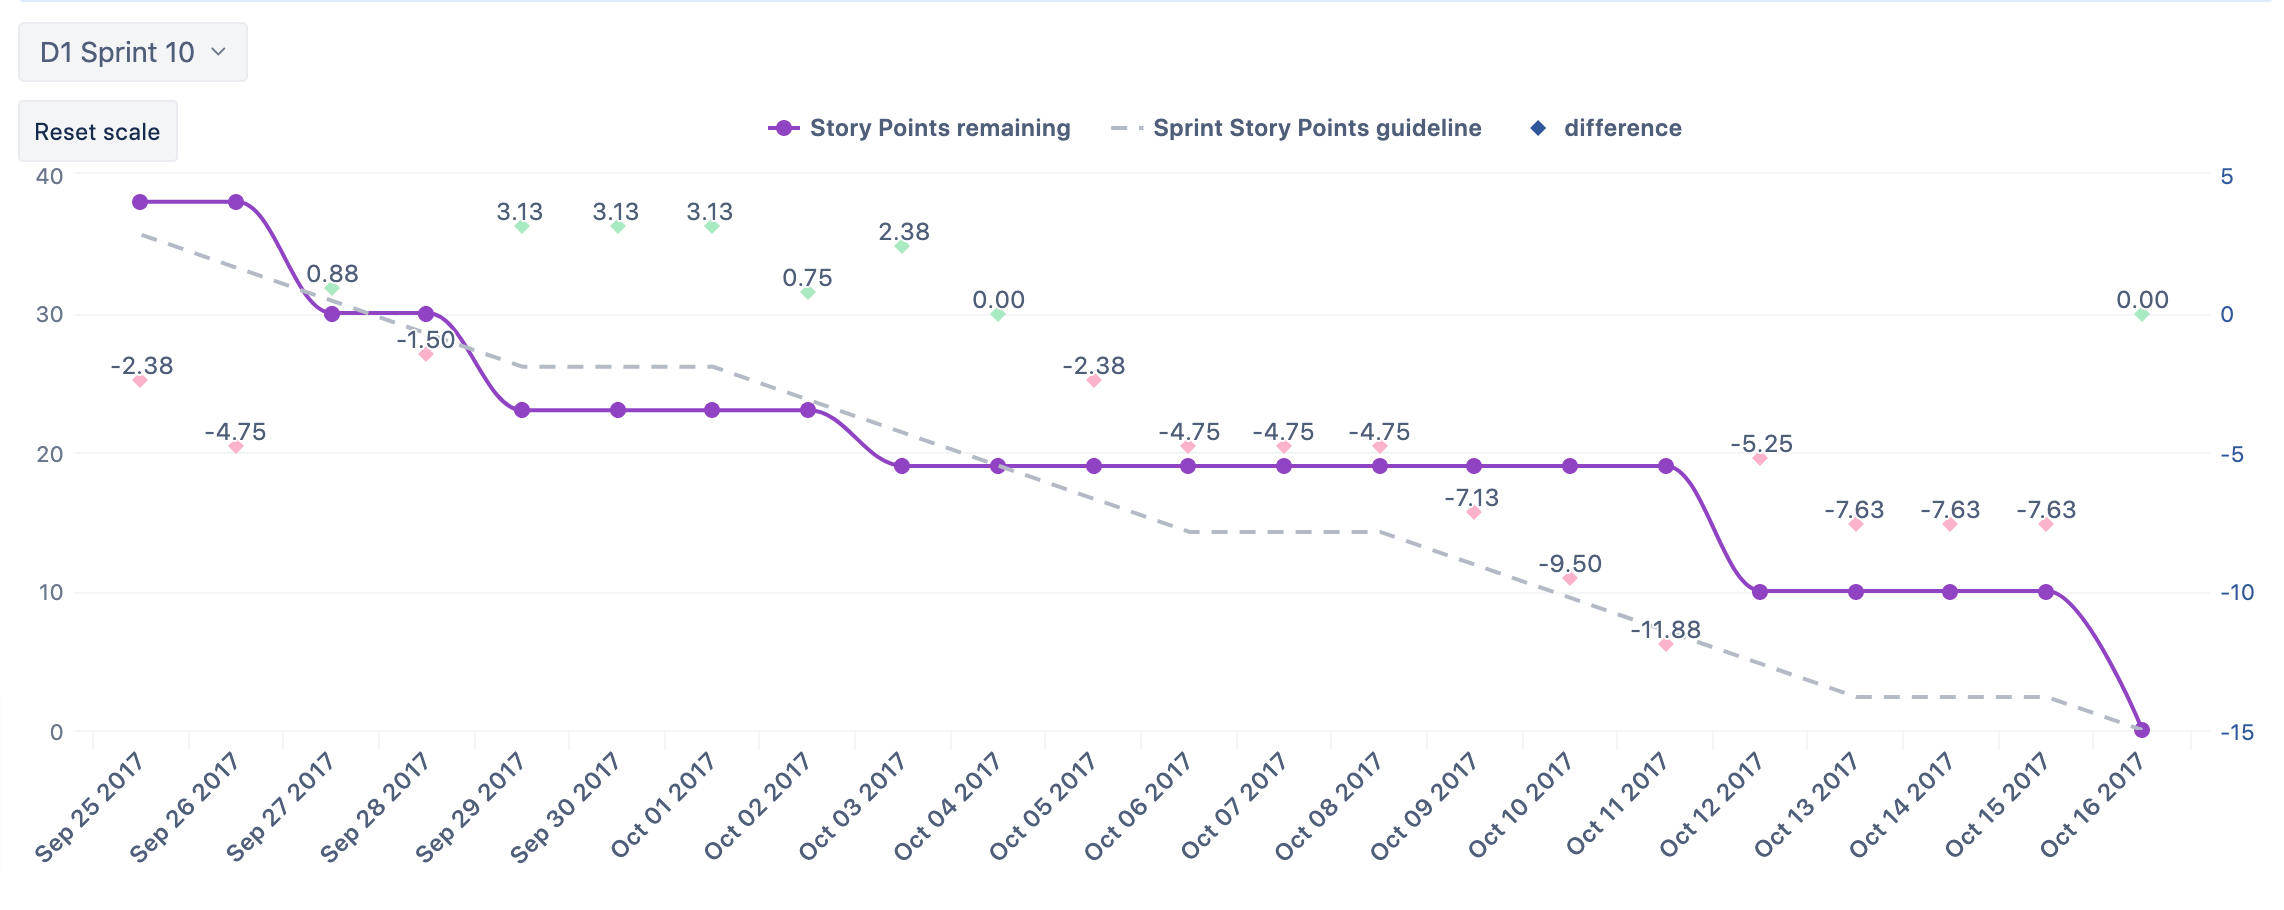
Find the chart type that works better for you:
text
or column

You may use cell formatting to color negative and positive values differently in the chart (i.e., when the actual remaining estimate is below/above the guideline). This option is already available on eazyBI Cloud; on Server and Data Center, it will be available starting from eazyBI version 6.4.
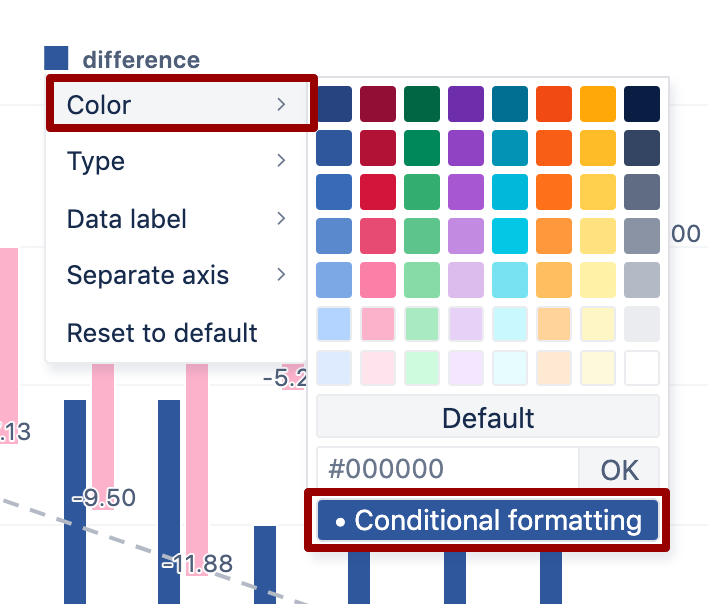
Read more: Charts conditional formatting - eazyBI
Best,
Ilze, support@eazybi.com