Hi,
We want to plot EazyBI predicted trend chart for bugs in an ongoing project. This plot is needed against known milestone dates: Start Date, A Date, B Date, C Date, End Date.
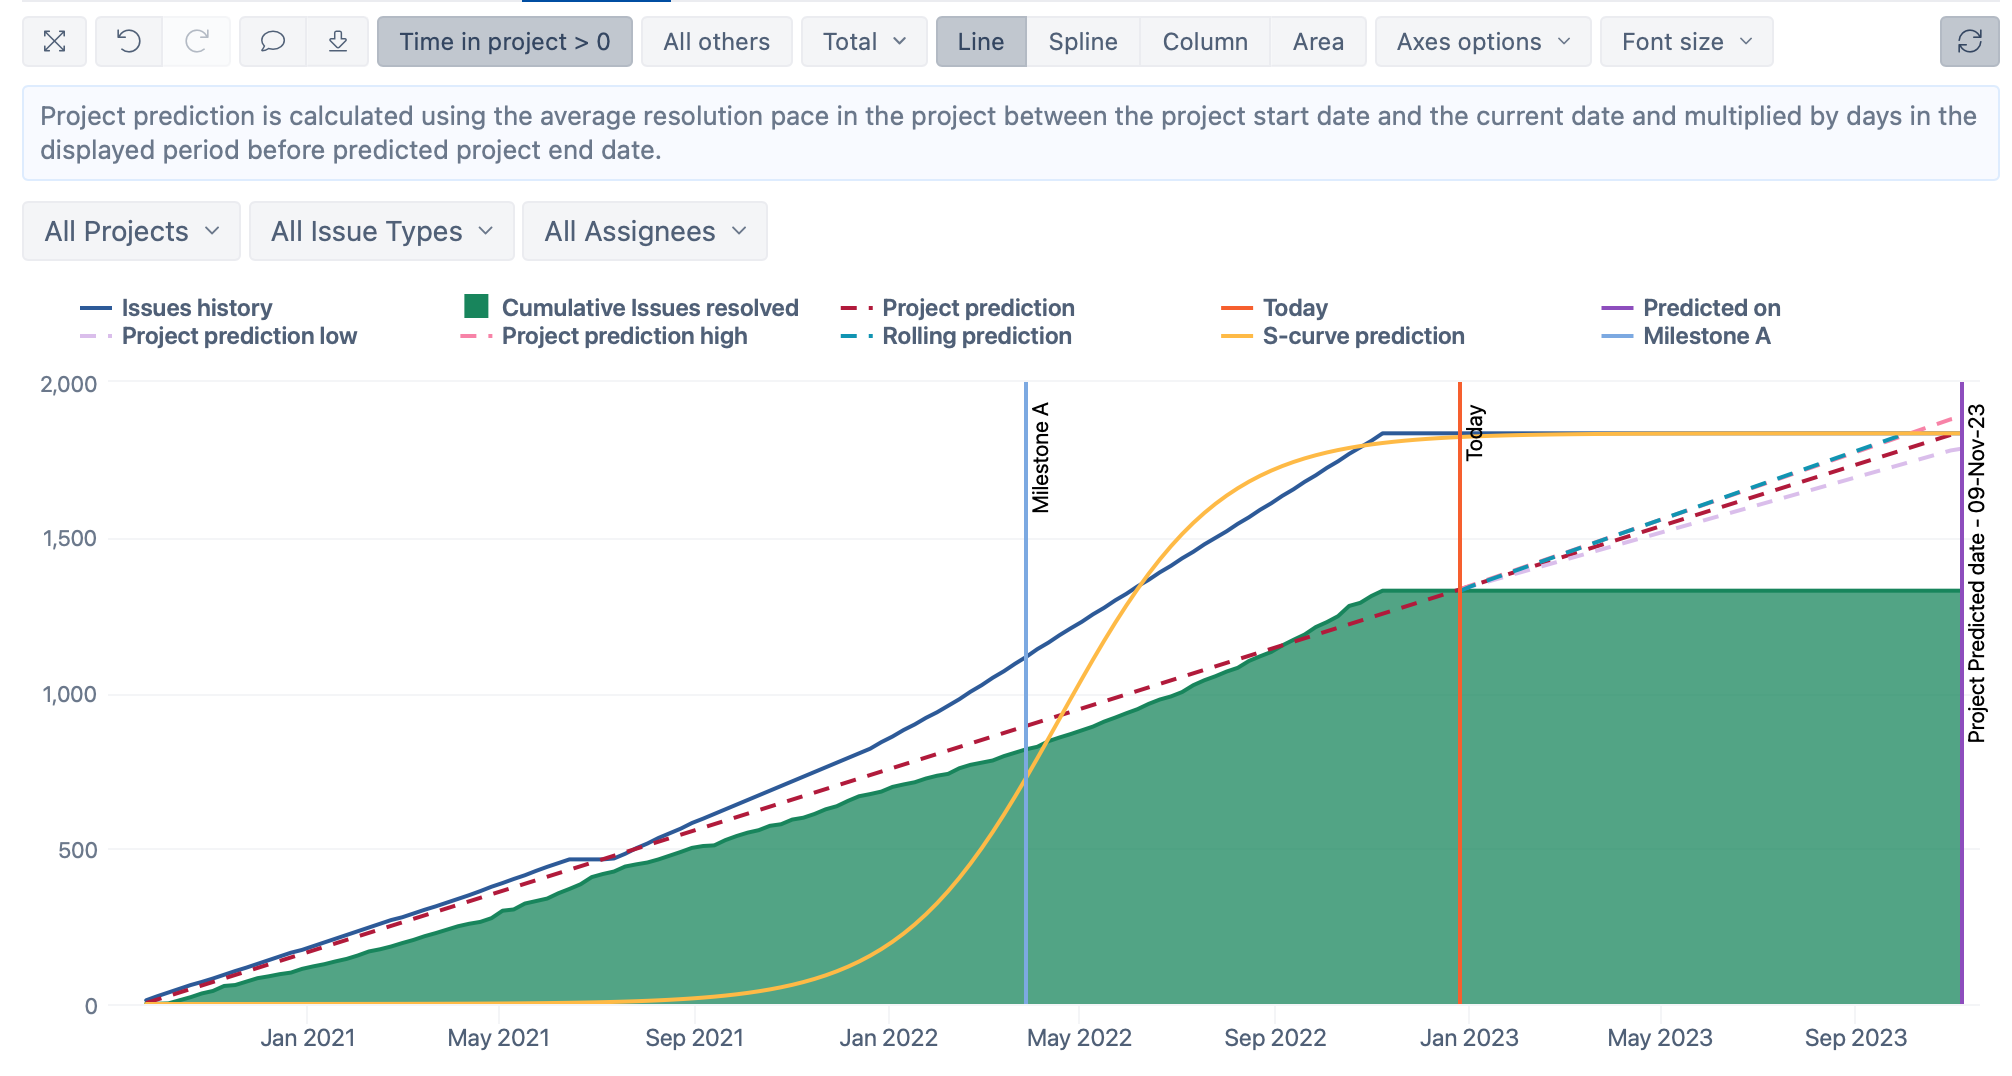
We checked eazyBI demo example: Project Prediction report - Issues - Jira Demo - eazyBI
Need further guidance on using milestone dates to plot predicted trend
The prediction calculation in this demo example is implemented based on the actual progress of the project, not considering any milestones. You can show milestones with a custom measure similar to “Today”:
CASE WHEN
DateInPeriod(DateParse('Apr 01 2022'),[Time].CurrentHierarchyMember)
THEN
  "Milestone A"
END
The S-curve prediction calculation can use the following formula:
--total scope
([Measures].[Issues created],
[Time].CurrentHierarchy.DefaultMember)

/
(1+Exp(-DateDiffDays(
DateAddDays(
  [Measures].[Project start date],
    -- "2" assume that s-curve meets the linear prediction in the middle of the project
  DateDiffDays([Measures].[Project start date],
    [Measures].[Project predicted date])/2
),
 -- "50" is the parameter of how steep will be the curve
        [Time].CurrentHierarchyMember.StartDate)/50))
/
(1+Exp(-DateDiffDays(
DateAddDays(
[Measures].[Project Start Date],
– “2” assume that s-curve meets the linear prediction in the middle of the project
DateDiffDays([Measures].[Project Start Date],
[Measures].[Project End Date])/2
),
– “50” is the parameter of how steep will be the curve
[Time].CurrentHierarchyMember.StartDate)/50))
Observations:
Cumulative count on x-axis is not increasing beyond today’s count.
Date on X-axis is not going beyond April 2023
Any suggestions?
Thanks,
Vrukesh
The cumulative is calculated from the resolved issues; it is not expected to increase in future periods. Perhaps, it makes sense to hide the cumulative for future periods to make the chart look cleaner.
The report uses the Time in the project filter. It uses the predicted completion date. You can adjust the formula for Time in project to consider your custom end date instead.
Hi Janis,
Since we want to predict Cumulative Created bugs for the project, we had done relevant changes for this in “Time in Project” field.
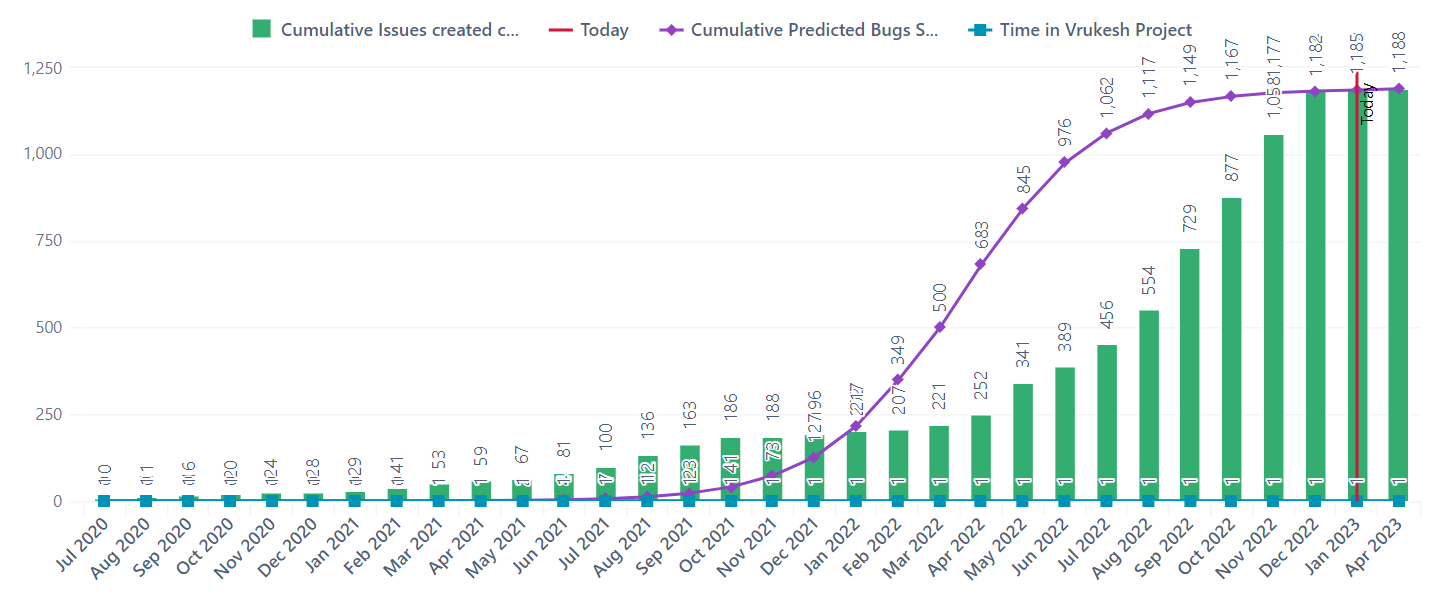
Somehow, the predicted S-curve trend is not shown till Project End date of December 2023.
Graph looks like below: