New measure for Resolved issue

Hello,

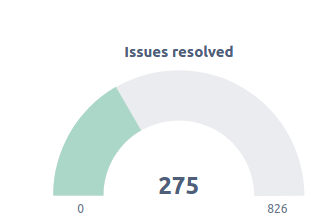
In our company , the mesure “Issue Resolved” is calculated based on specific status which is different from what is by default in easybi.

So we create a new measure :
Count(
Filter([Issue].[Issue].Members,
[Measures].[Issue status] = “VALIDATION (DONE)”
OR
[Measures].[Issue status] = “PREPROD (WIP)”
OR
[Measures].[Issue status] = “PREPROD (DONE)”
OR
[Measures].[Issue status] = “DEPLOYEMENT (WIP)”
OR
[Measures].[Issue status] = “DEPLOYEMENT (DONE)”
OR
[Measures].[Issue status] = “CLOSED”
)
)

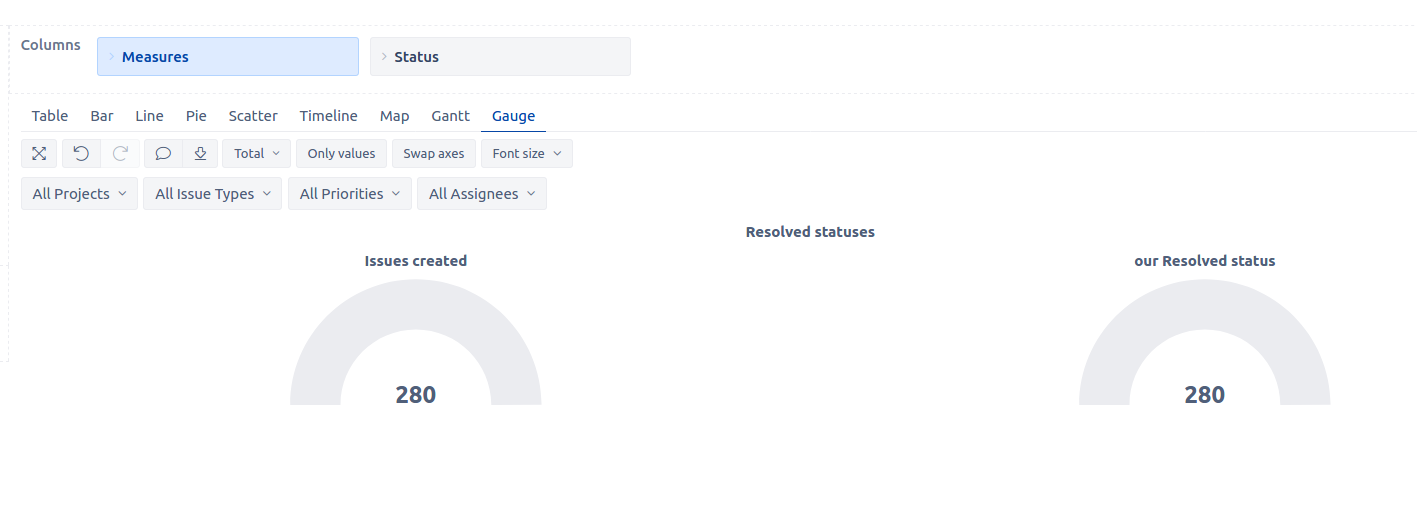
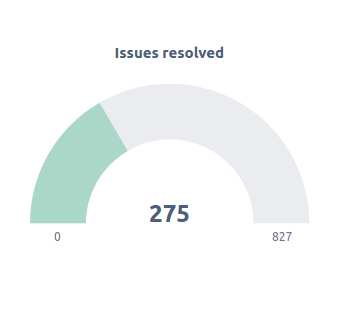
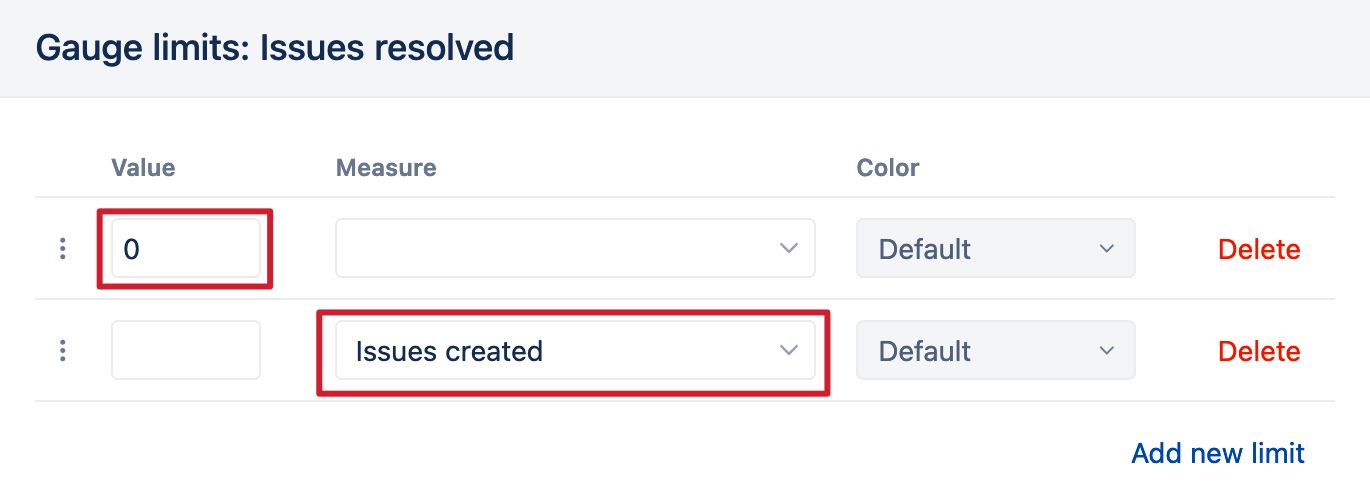
So i had a problem when create this graph :
image

i replaced Resolved issue by the new measure but i got two separated gauge ? how can i correct this?

thanks

Hello @nour,

You might want to use a bit different approach to count issues in specified closed statuses in your case.

  1. In the Status dimension, define a calculated member “Resolved statuses” to aggregate all closed statuses.

    Aggregate({
      [Status].[status 1],
      [Status].[status 2]
    })
    

More details on calculated members: Calculated members in other dimensions - eazyBI for Jira

  1. In Measures, define a new calculated measure using a tuple of measure “Issues created” and the newly created member from the Status dimension.

    ([Measures].[Issues created],
    [Status].[Resolved statuses])
    

More details on how to create a tuple: Calculated measures - eazyBI for Jira

Best,
Zane / support@eazyBI.com

Hello @zane.baranovska ,
thanks for your answers, but i still have the same problem:

  1. for the first proposition :

I get 2 gauges

  1. I create a new measure but i still get 2 gauges:

====> My object is to create this graph based on our specific formula of resolved issues:

image

Please Help

Nour

@nour, you can set measure “Issue created” as the limit for the Gauge chart.

  1. Starting point is to have two Gauges, one for “issues created” and another for “our Resolved status,” as you do have now.
  2. Click on the “our Resolved status” and select the option "Gauge limits"
  3. In the Gauge limit screen, set measure "Issues created as the upper limit for gauge (see picture below).

More details on the gauge chart are here: Create charts - eazyBI for Jira.

Best,
Zane / support@eazyBI.com

1 Like

It works :smile:

thanks a lot