Hello Nicole,
The best solution for this would be to import Story points as a dimension. By default Story Points cannot be imported as a dimension; to change this, you should apply some advanced settings in eazyBI.
Go to advanced settings and add the following settings for the Story Points custom field:
[jira.customfield_NNNNN]
data_type = "integer"
measure = true
dimension = true
where NNNNN is a custom field “Story Points” ID in Jira.
Then, go to import options and select the “Story Points” custom field to import as a dimension.
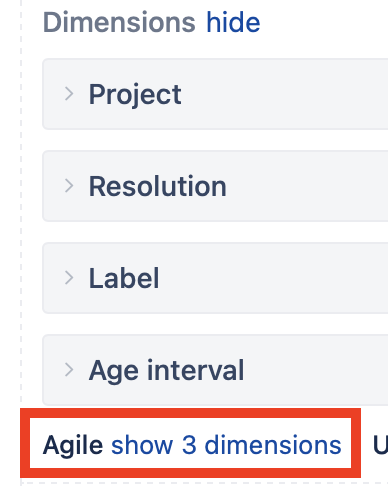
After the data import, you may find the Story Points dimension under Agile dimensions.

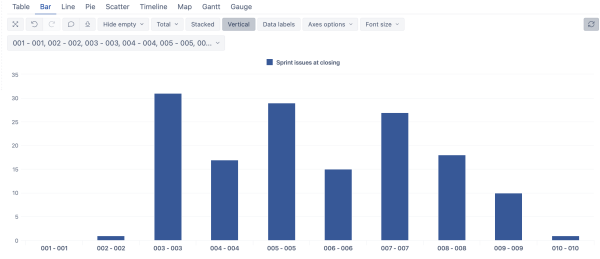
You can use this new Story point dimension and the ‘Sprint issues at closing’ measure to see how many issues are in each Story point group.
I created this chart:

Would you please let me know if you succeeded!
Kind regards,
Oskars / support@eazybi.com