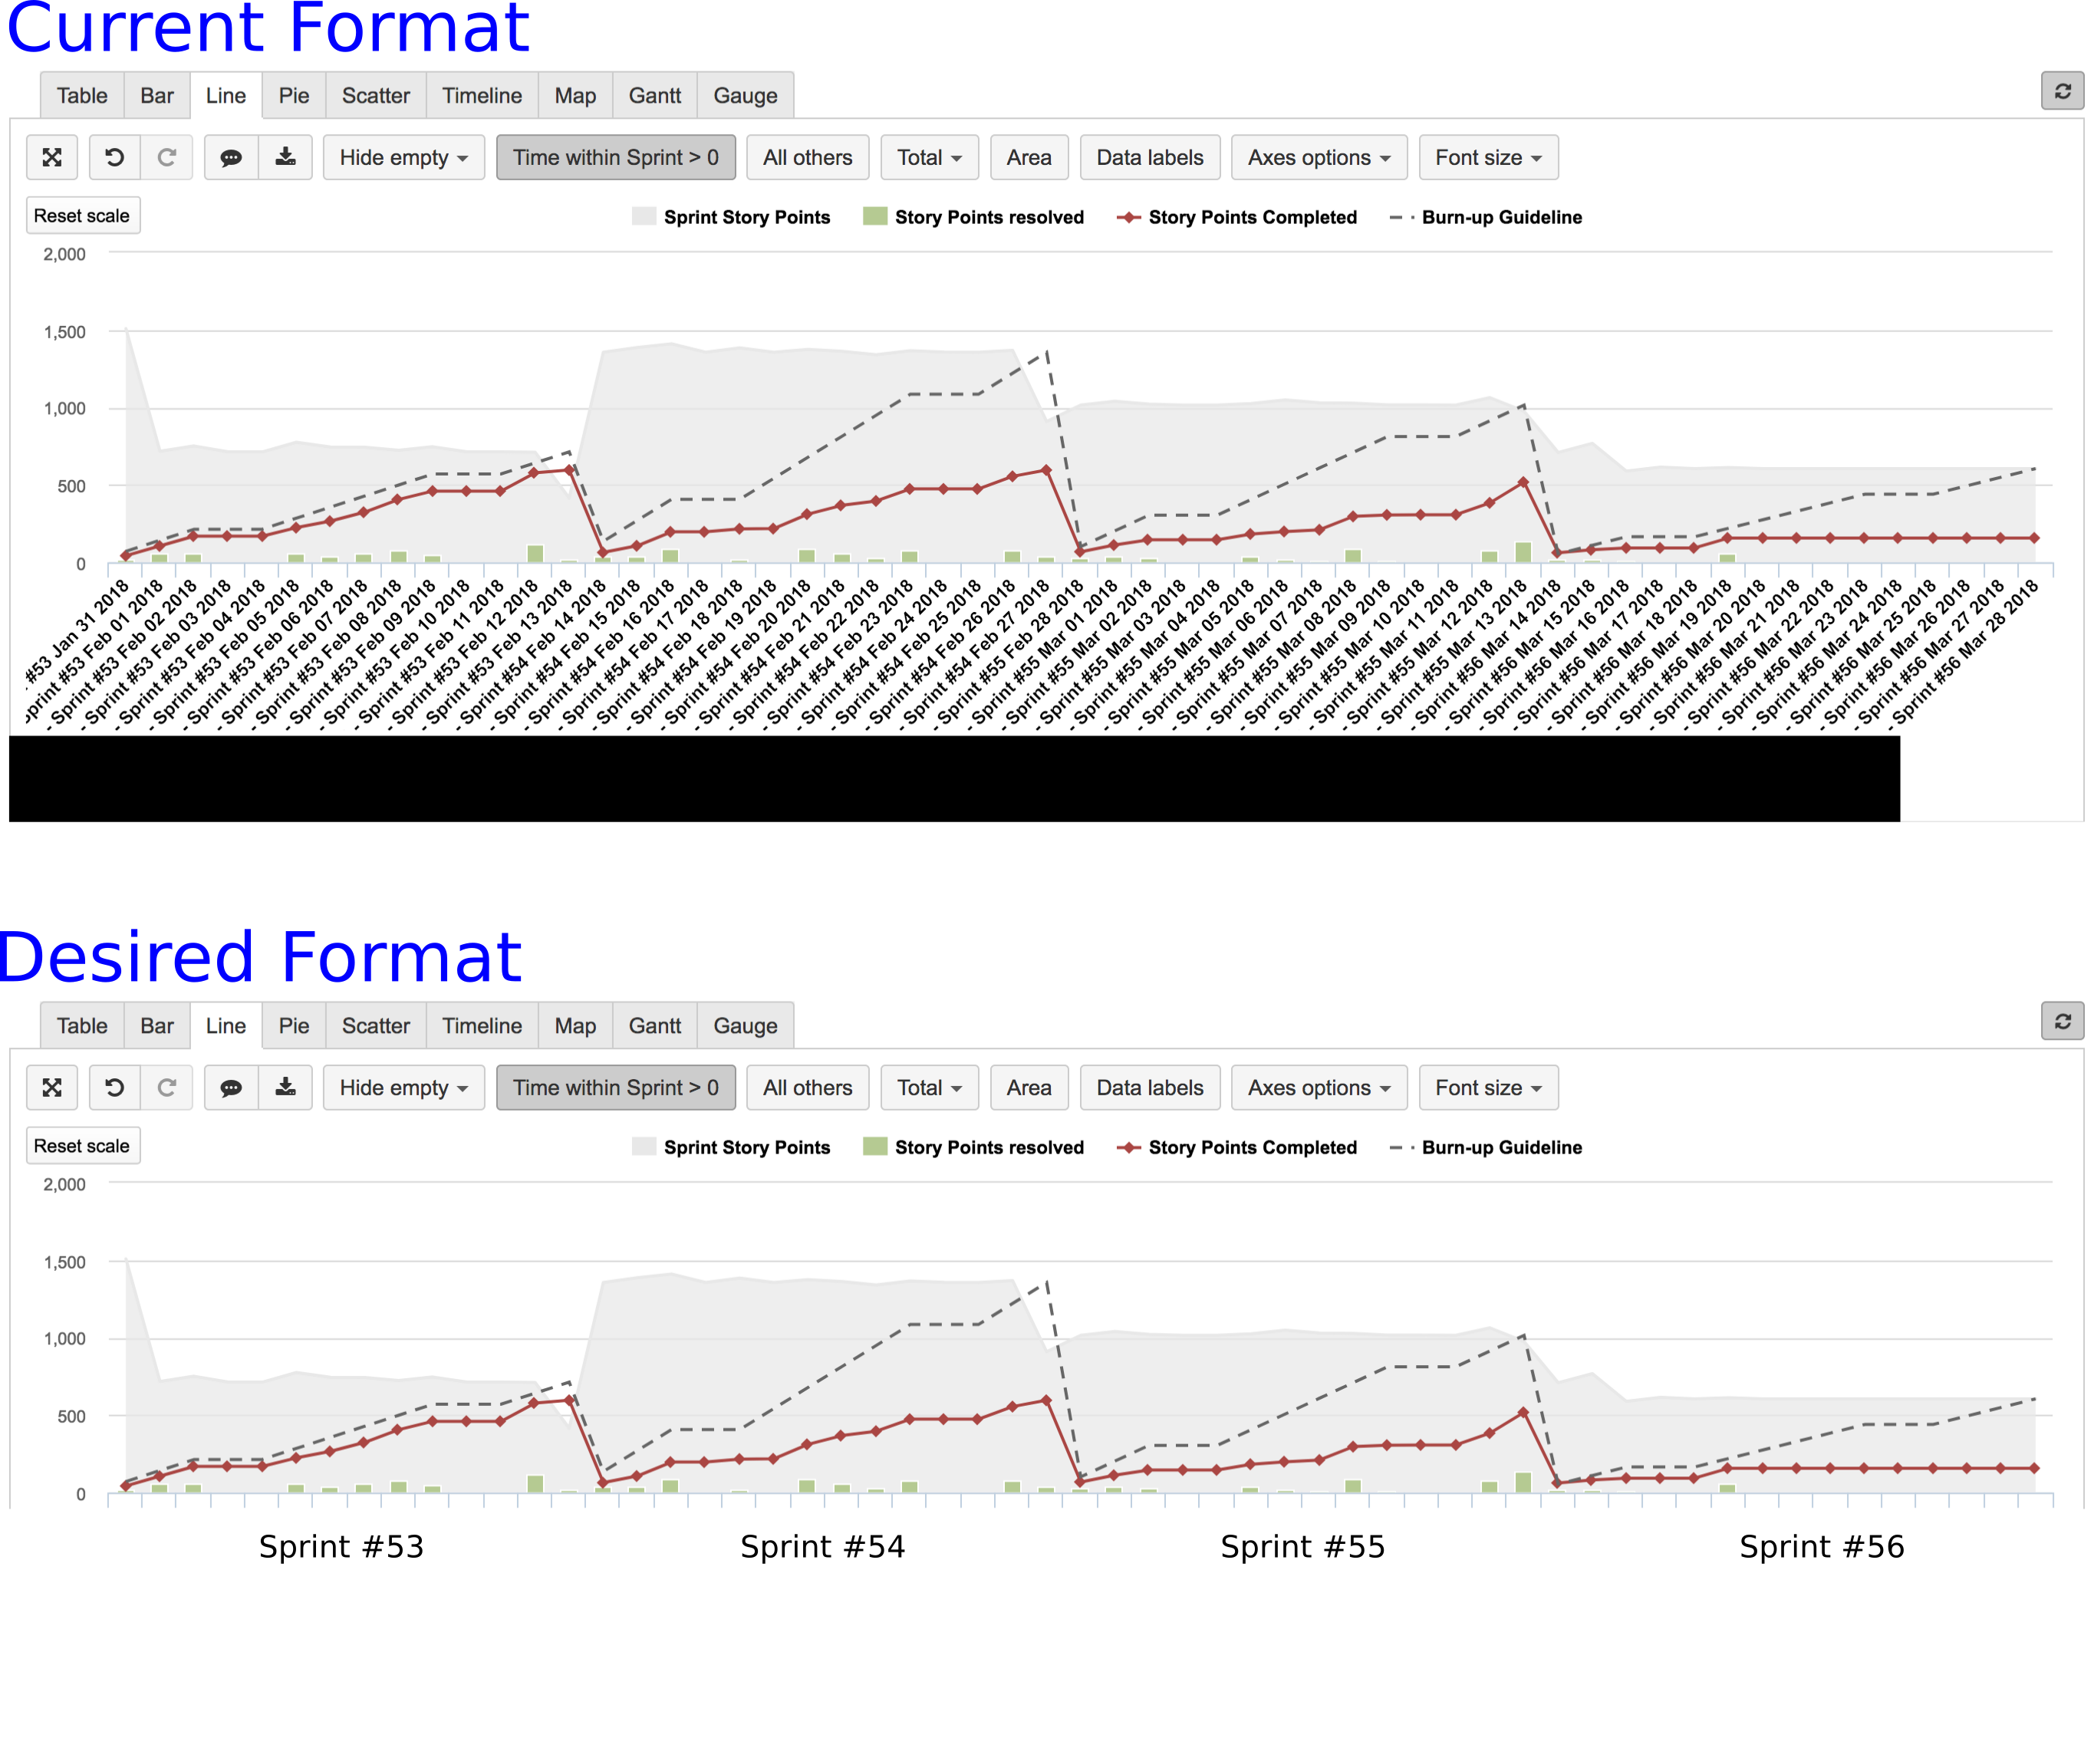
I am working on a burn-up chart that spans one of my organization’s three-sprint-long iterations. Each sprint is two weeks long, so I am plotting 42 days’ worth of information. EazyBI insists on a full label for each data point in the format <Sprint Name> <Datestring>. Consequently, the labels take up almost a third of the chart’s vertical space.
If I graph a single sprint, I get a much more pleasant axis label; the columns are individually labeled with <Datestring> and, underneath, the entire series is sublabeled <Sprint Name>.
I would like to know how to do one of the following while still plotting multiple sprints:
- Omit the
<Datestring>portion of the axis label, leaving only the broad<Sprint Date>sublabels. - Get the same formatting as a single sprint, with individually-labelled dates and broad
<Sprint Date>sublabels.
Option 1 is the preferred solution, but we will accept option 2 if option 1 is not possible.