Hi all. New to eazyBI (and cube reporting in general) so apologise in advance for dumb questions!!
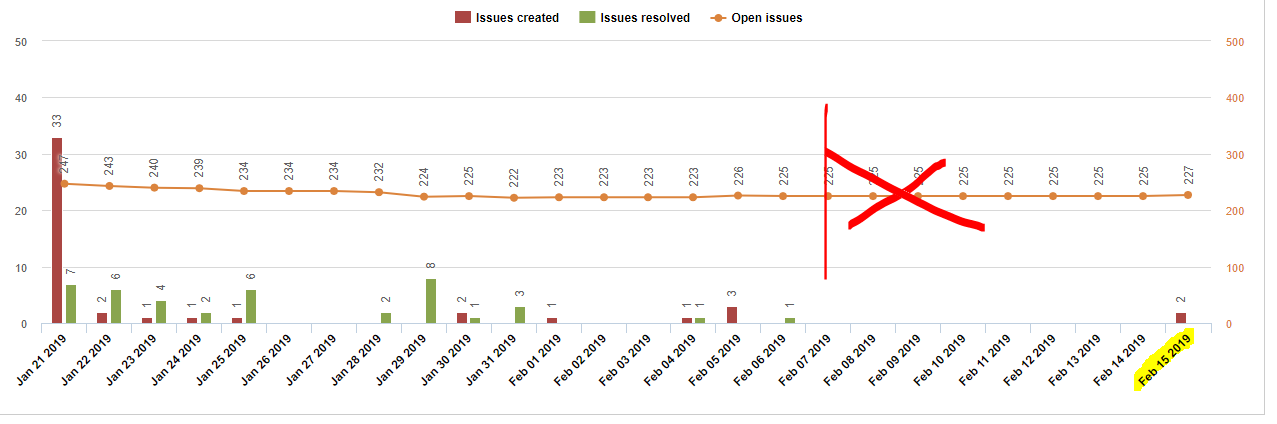
A customer of mine has a graph already created which shows bug count over time to show resolved etc. They want to keep the date range as being the full increment (so for example the next 3 months). But they want the bug count data line on the graph to stop when current actual data stops (or I guess at today maybe). Is that possible? Screenshot here hopefully helps as well!
Can anyone help with this?
I’m not sure if it’s what you meant but here’s how you “filter” your date axis:
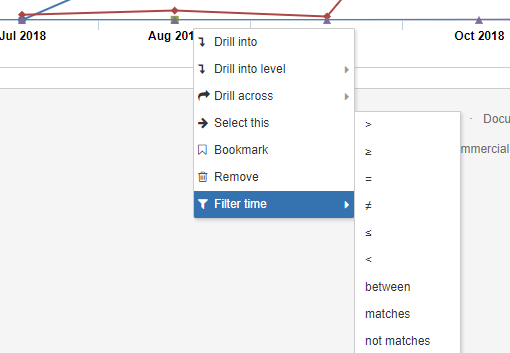
And you can choose “< today” , or “<3 months from now” or “between 1 aug 2018 and today” and so on.
Here you have full time manual:
https://docs.eazybi.com/eazybi/analyze-and-visualize/date-filters
Hi, thanks for the reply but no, that restricts what is shown on the x-axis. What I want is for the x-axis to continue for the duration of the project (3 months say), but for the line that is showing actual data (Open Issues in this case) to stop when there’s no more ‘real’ data - which in effect means today’s date I guess.
The Open Issues code looks like this - is there a way to tell it to ignore something beyond today’s date?
CASE WHEN [Issue].CurrentMember.Level.Name <> ‘Issue’ THEN
Cache(
NonZero(Sum(PreviousPeriods([Time].CurrentHierarchyMember),
Cache([Measures].[Issues created]
- [Measures].[Issues resolved])
))
+ [Measures].[Issues created]
- [Measures].[Issues resolved]
)
WHEN [Time].CurrentHierarchyMember IS [Time].CurrentHierarchy.DefaultMember
THEN NonZero([Measures].[Issues due])
ELSE
– optimized formula for drill through Issue
NonZero(IIF(
DateBeforePeriodEnd(
[Issue].CurrentMember.get(‘Created at’),
[Time].CurrentHierarchyMember) AND
NOT DateBeforePeriodEnd(
[Issue].CurrentMember.get(‘Resolved at’),
[Time].CurrentHierarchyMember),
([Time].CurrentHierarchy.DefaultMember,
[Measures].[Issues created]),
0
))
END
Hi @frontoftheherd,
You could try to limit the measure “Open issues” to display values up until today with a condition like CASE WHEN. Please create a new calculated measure with the formula below:
CASE WHEN
  DateCompare(
    now(),
    [Time].CurrentHierarchyMember.StartDate
  ) > 0
THEN [Measures].[Open issues]
END
This measure will compare the Time dimension member start dates on the X axis to the date now. It will display the value of “Open issues” only when today’s date is bigger than the Time dimensions members start date.
You can read more about conditions in eazyBI and the DateCompare function on our documentation page.
Kind regards,
Roberts // eazyBI support
2 Likes
Hello @roberts.cacus
Thanks for the tip above to limit a measure to display values till today.
I am trying to do the similar with the work logged, I am plotting the cumulative effort spent on the X axis. I am doing this by first plotting the measure “Days spent” measure - this is calculated by HoursSpent/8, then adding the “Cumulative Days spent without empty” to the report. This “Cumulative days spent without empty” is not defined as a measure, but calculated at run time. How do I define this “Cumulative days spent without empty” as a measure, so that I can limit its plotting to plot till today’s date using the above tip?
Thanks!
Hi @nec2152 ,
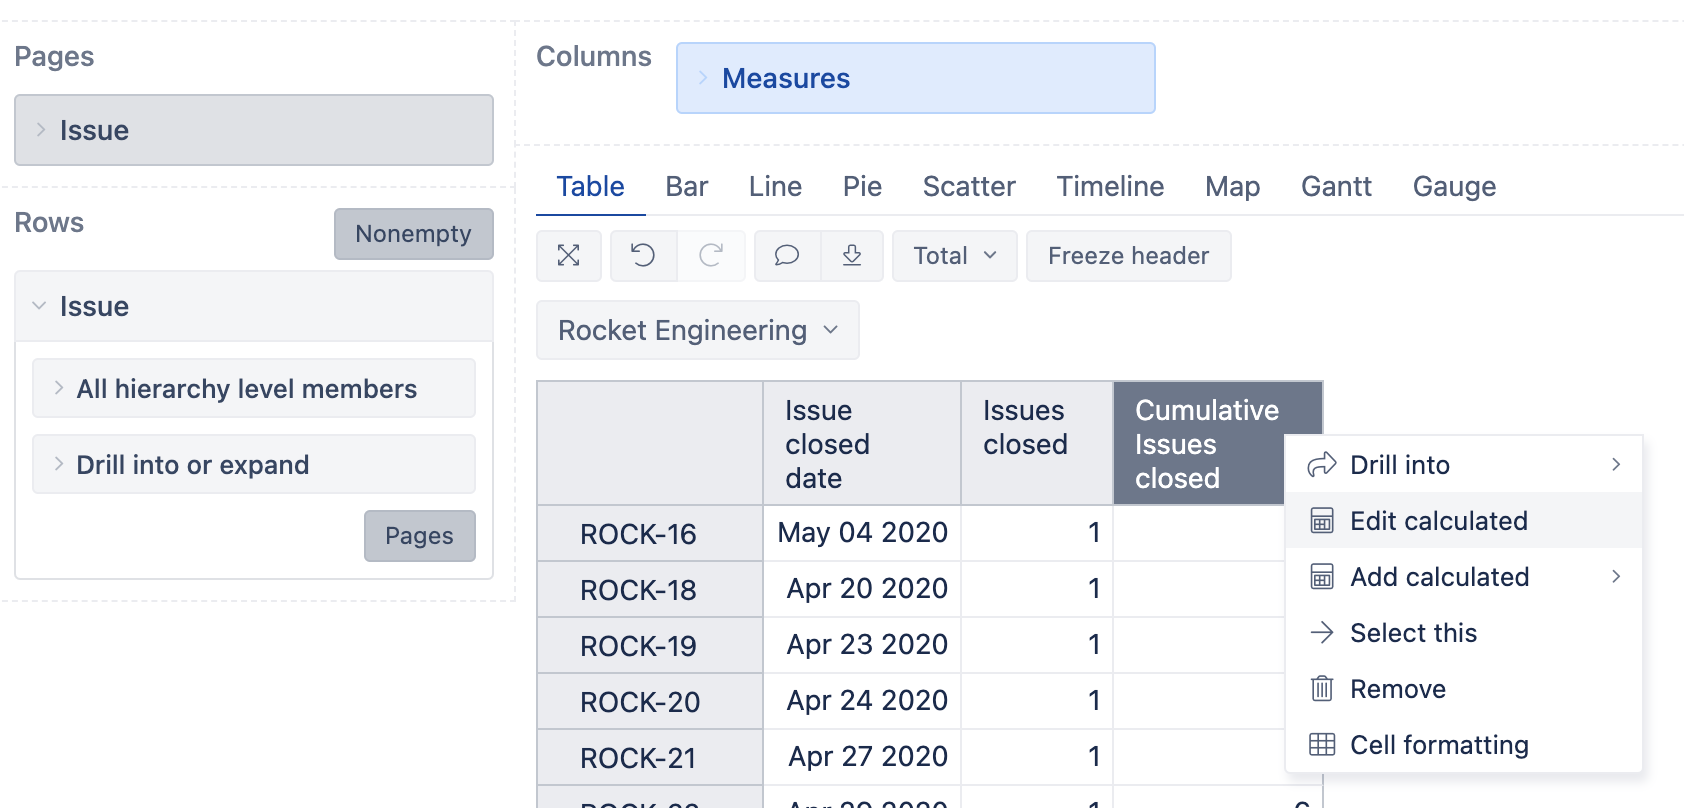
You are probably referring the the Standard calculations - Create reports - eazyBI for Jira.
You can copy the standard calculation measure formula by clicking on it in the report columns and selecting “Edit calculated”. See the picture below:
Copy the formula and use it in a new calculated measure.
Best,
Roberts // support@eazyBI.com