Hi
I’m working with EazyBi for some time and many users from my organization would like to have a report that will be “Partial Pivot Table” what I mean by that is to have the ability to put some of the properties/measures without replicated measure by each dimension member.
For example, I would like to have
Rows:
Issues
Columns:
Time
Measures
From Mesures I would like to select: Hours Spent, Remaining, and Issue Status.
What it would give me is a pivot table where all three measures repeat by Time members. For Hours Spent and Remainings this is what I would like to have but status I would like to have only once before the time so it would not be repeated and will only show current status.
Above is of course only a simple example as this is somehow doable with the Status dimension but I have now requested a report that will have 5 columns like the Status mentioned before and only 3 that would be reputable by time.
We added the option Drill into a single measure by another dimension level with the version 5.3.
You can add any measure to the report and then use the option drill into for one measure (one at a time) and specify a dimension you would like to see use with this measure.
Here is one example report in our dimension. It shows an overview for Versions and uses an option drill into status by category for measure Issues created to show the progress of issues in the version:
https://eazybi.com/accounts/1000/cubes/Issues/reports/846789-fix-version-release-gantt-chart-basic
Daina / support@eazybi.com
Well
That will not fit my problem this is something what I would like to achive
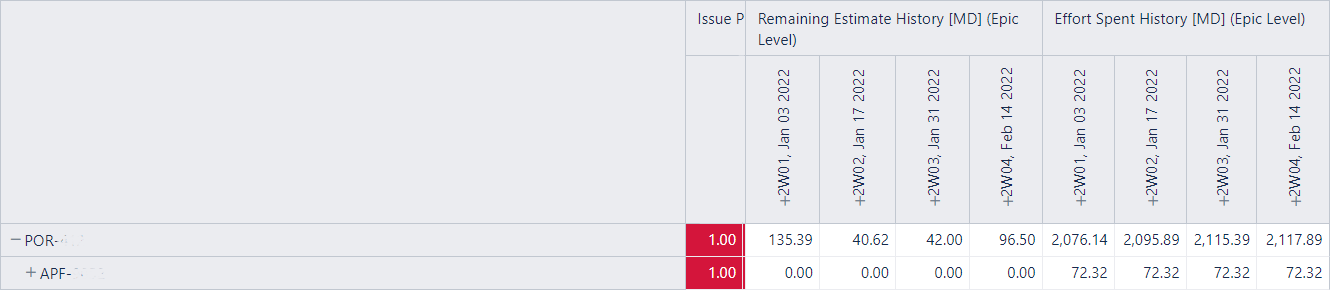
The report screenshot matches the request: the first column shows without time repeating, then two following measures Remaining estimate history and Effort Spent history is split by time.
Could you clarify if this the report you could create based on the suggestion, but there is still something missing or you could create this only using some formulas? Some additional details will help us give a more precise answer.
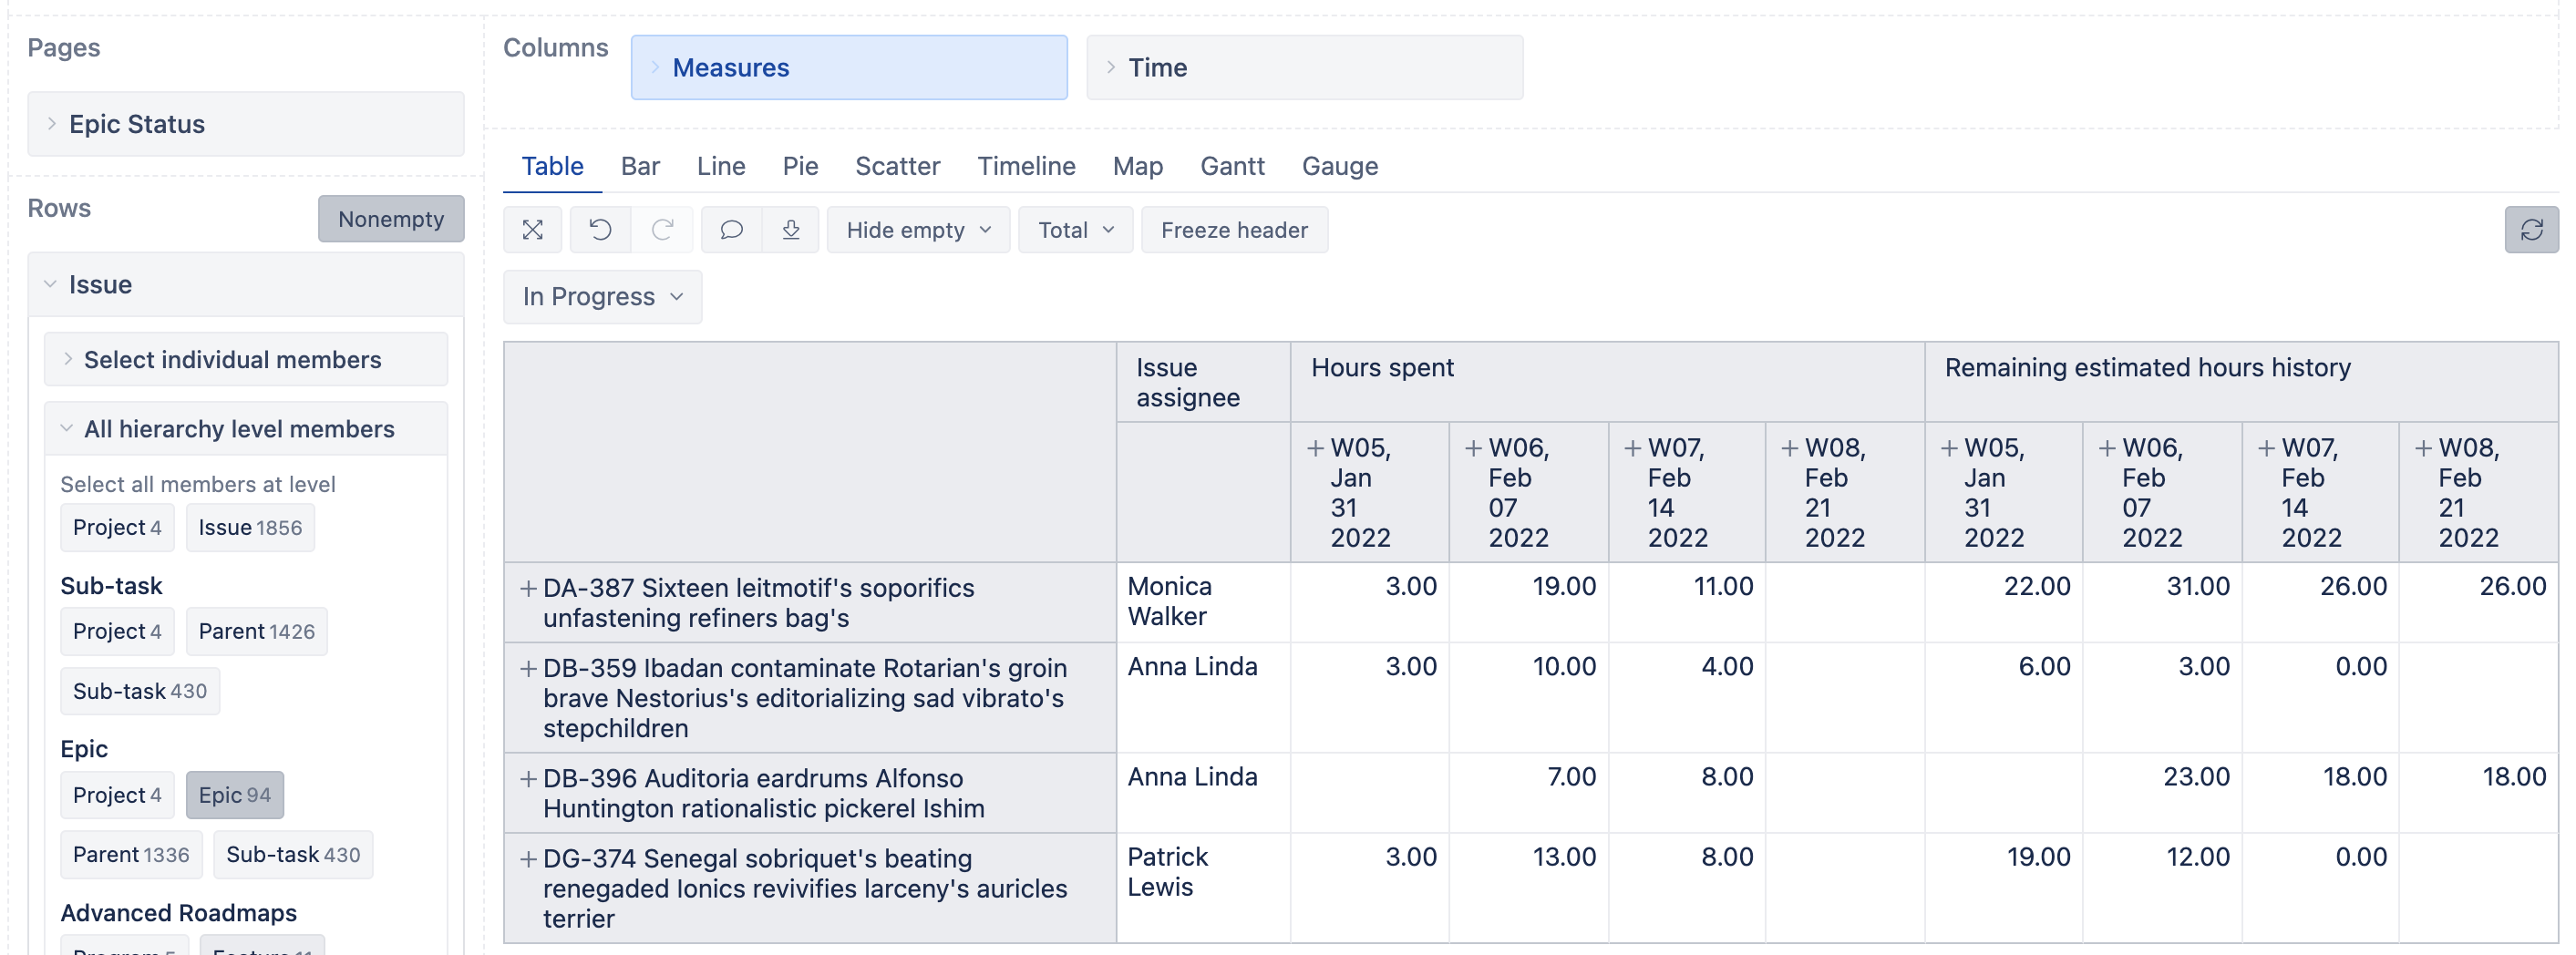
In any case, here are more details on how I could create a similar report with default measures Hours spent and Remaining estimated hours history, and property Issue assignee. Here are the steps I did to get it working:
- Select the Hours spent and use the option drill into > Time and select All times (or a specific level, for example, weeks).
leave the time dimension as is it for now - we will set the needed selection on the last step.
- select the Remaining estimated hours history and use the option drill into > Time and select the same selection as for the first one (All times or level).
- Then expand the Time dimension on the Column and make the needed selection. For example, select Last 4 weeks. Expand it in the report and then deselect the last 4 weeks leaving the expanded weeks only.
You can make any time selection here. The only limitation is - you can’t use the same dimension on Pages for selection.
Here is my report:
Daina / support@eazybi.com