Hi, I’m trying to calculate the percentage completion of committed issues in a Sprint.
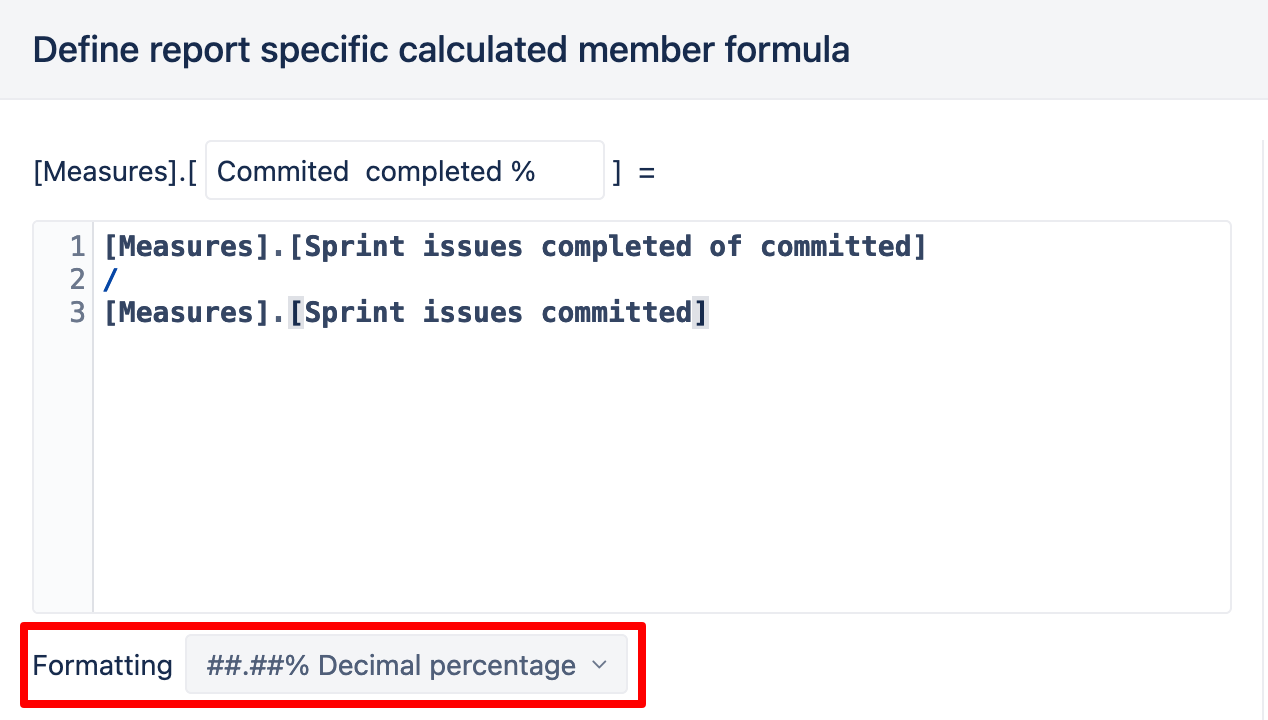
To do this, I’ve so far created a new calculated measure:
[Measures].[Sprint issues completed of committed] / [Measures].[Sprint issues committed]
Using Project as Pages and Sprint as Rows
In the bar chart format, I seem to get the right (almost) result, with a series of bars, one for each sprint, going up a scale of 0 , 0.1, 0.2…1, however on the table view the above measure’s value is displaying as ‘1’. If I hover over the data points on the bar chart view, it is also 1 (despite the bar chart showing differently).
What am I missing here?