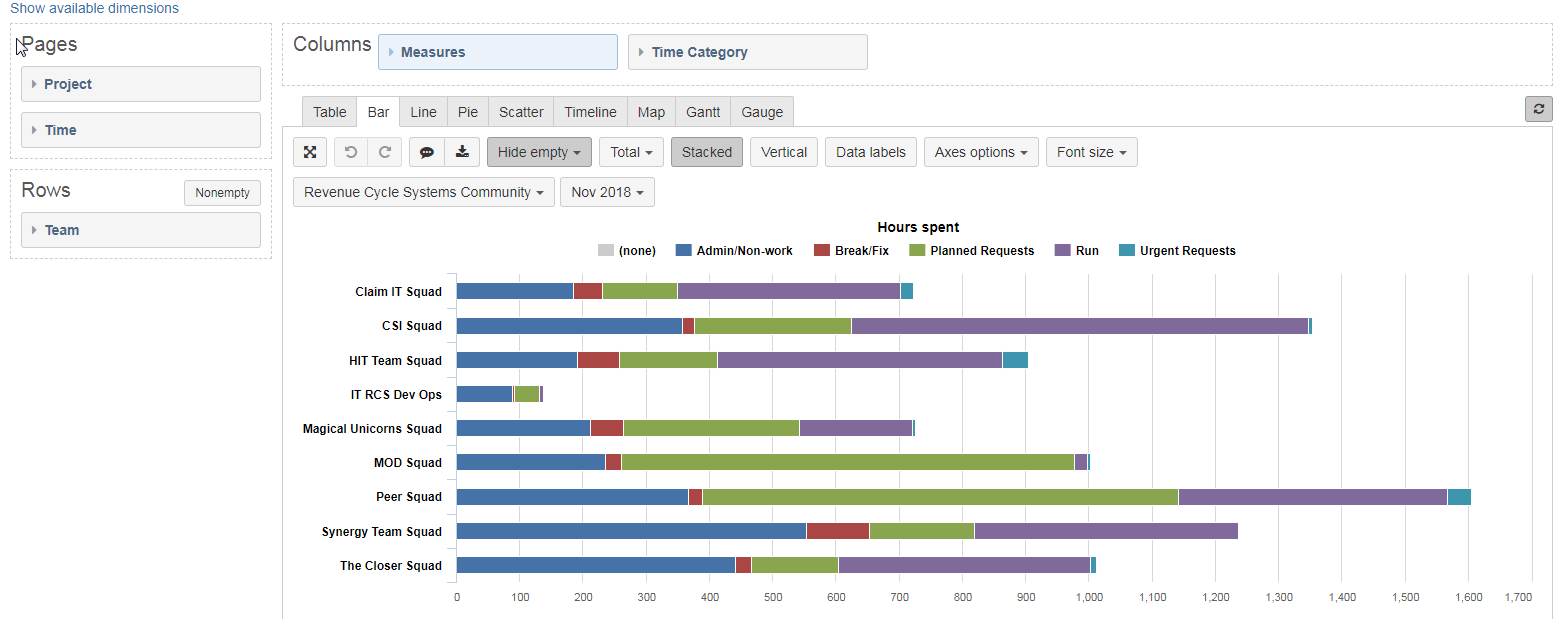
I have a stacked bar showing breakdown of a custom time tracking category field. ‘Data Labels’ will give me the raw # but i want to see as a % of total. is there an easy way to do this?
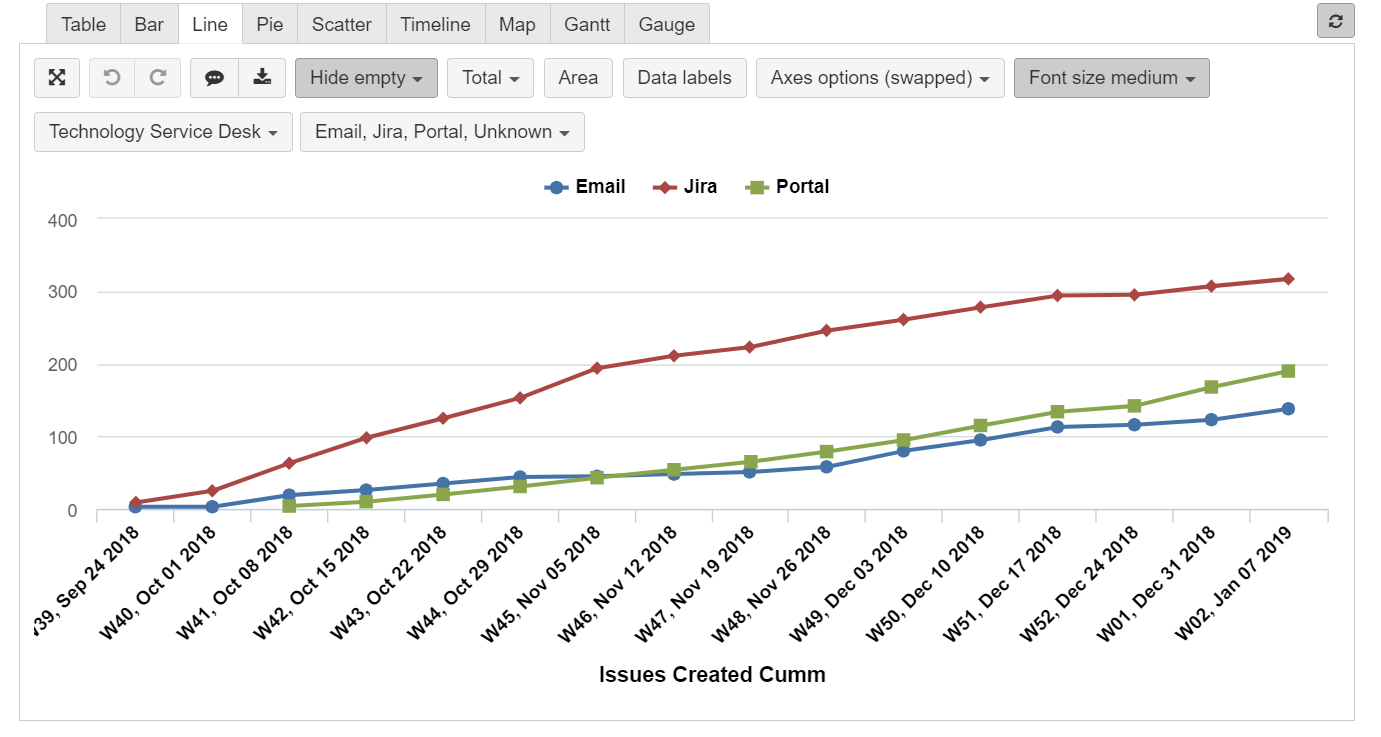
How interesting. Working on the VERY same thing here. Working on a report that depicts the channel of Service Desk tickets. I have been able to establish how to make this a cumulative report but would like to switch it from a number count (Issues Created) to a percentage of the column total.
Chart
Report export
{
“cube_name”: “Issues”,
“cube_reports”: [ {
“name”: “DNT - Request By Channel Cumm (SD)”,
“folder_name”: “SD Reports”,
“result_view”: “line_chart”,
“definition”: {“columns”:{“dimensions”:[{“name”:“Measures”,“selected_set”:["[Measures].[Issues Created Cumm]"],“members”:null},{“name”:“Time”,“selected_set”:["[Time.Weekly].[Week].Members"],“members”:null,“bookmarked_members”:null}]},“rows”:{“dimensions”:[{“name”:“Channel”,“selected_set”:["[Channel].[Email]","[Channel].[Jira]","[Channel].[Portal]","[Channel].[Unknown]"],“members”:null,“bookmarked_members”:null}]},“pages”:{“dimensions”:[{“name”:“Project”,“selected_set”:["[Project].[All Projects]"],“members”:[{“depth”:0,“name”:“All Projects”,“full_name”:"[Project].[All Projects]",“drillable”:true,“type”:“all”,“expanded”:true,“drilled_into”:false},{“depth”:1,“name”:“Technology Service Desk”,“full_name”:"[Project].[Technology Service Desk]",“drillable”:true,“key”:“SD”,“parent_full_name”:"[Project].[All Projects]"}],“bookmarked_members”:null,“current_page_members”:["[Project].[Technology Service Desk]"]},{“name”:“Channel”,“duplicate”:true,“selected_set”:["[Channel].[All Channels]"],“members”:[{“depth”:0,“name”:“All Channels”,“full_name”:"[Channel].[All Channels]",“drillable”:true,“type”:“all”,“expanded”:true,“drilled_into”:false},{“depth”:1,“name”:“Email”,“full_name”:"[Channel].[Email]",“parent_full_name”:"[Channel].[All Channels]"},{“depth”:1,“name”:“Jira”,“full_name”:"[Channel].[Jira]",“parent_full_name”:"[Channel].[All Channels]"},{“depth”:1,“name”:“Portal”,“full_name”:"[Channel].[Portal]",“parent_full_name”:"[Channel].[All Channels]"},{“depth”:1,“name”:“Unknown”,“full_name”:"[Channel].[Unknown]",“parent_full_name”:"[Channel].[All Channels]"}],“bookmarked_members”:null,“current_page_members”:["[Channel].[Email]","[Channel].[Jira]","[Channel].[Portal]","[Channel].[Unknown]"]}]},“options”:{“nonempty”:true},“view”:{“current”:“line_chart”,“maximized”:false,“line_chart”:{“area”:false,“swap_axes”:true,“data_labels”:false,“series_options”:{},“font_size”:“medium”},“table”:{}}}
} ],
“calculated_members”: [{“name”:“Issues Created Cumm”,“dimension”:“Measures”,“formula”:“Sum(\n {\n PreviousPeriods([Time].CurrentHierarchyMember),\n [Time].CurrentHierarchyMember\n },\n [Measures].[Issues created]\n)”,“format_string”:"#,##0"}]
}
Wow. Thanks for the response and I love your report. Looks like we are trying to get to the same thing. I’m an eazybi beginner and have no even created calculated fields but I guess that’s what I’ll need to do?
I’d like to create a report like yours but we are trialing service desk now and it’s not likely it’ll be adopted any time soon. ALL jira issues/requests come to me (2,000 users) either through direct email or a specific jira project. What are you using for ‘email’ (email handler?) and ‘jira’ for your report ? Are you using issue types or components to classify requests ?
Very much a beginner here as well, from an Admin standpoint. Long time Jira user, but now own the product.
We are using the default JEML for our email. We are entirely cloud given our size.
For my customer (non agent employees) I have them entering requests through either the portal or email. Email routes directly to one general component, which we then classify accordingly. Tickets that come in through the portal are auto-routed to a specific component, but this is a hidden field from the employee.
I’m just using component to classify and track metrics for now, and not physically routing the work to my team by component. Baby steps. 
Hi,
The Pie chart is the only chart type in eazyBI where it would be possible to show # and % at the same time by turning on Data labels.
If you use Bar chart type, you could use a different approach:
-
Create a new calculated member (with % formatting) in “Measures” dimension to calculate results in %
try this code example:[Measures].[Hours spent]
/
(
[Measures].[Hours spent],
[Time Category].CurrentHierarchy.DefaultMember
) -
Select this new measure as the only measure. (then eazyBI would automatically show % as data label and also values on X-axis)
See attached gif
Martins / support@eazybi.com