I’m looking for advice for performance optimization with the measure
   MAX(
      Filter(Descendants([Issue].CurrentHierarchyMember, [Issue].[Issue]),
      [Project].CurrentMember.Name = 'abc'
      AND
      [Measures].[Issues created]>0),
      [Measures].[Avg memory numeric]
)
I use 4 similar measures and report with graph for each of them (so 4 graphs in total) fails due to memory issues.
Currently, for single measure it takes about 15-25 seconds to build a graph with 6 values when I’m changing page filter values, e.g. “Epic” page filter value. E.g. I have epic ‘A’ and ‘B’, each has 6 values considering all other page filters I apply. So when I change ‘Epic’ filter from A to B or visa versa, it takes 15-25 secs to build a graph.
I tried page filters and Filter function in measure to limit number of records, but there is no effect on performance, looks like the measure work with all tickets in jira despite on filters. Currently, my jira has about 700k tickets, but for project ‘abc’ it is 10k tickets. But when I add function with additional filter for project value = ‘abc’ performance is not changed.
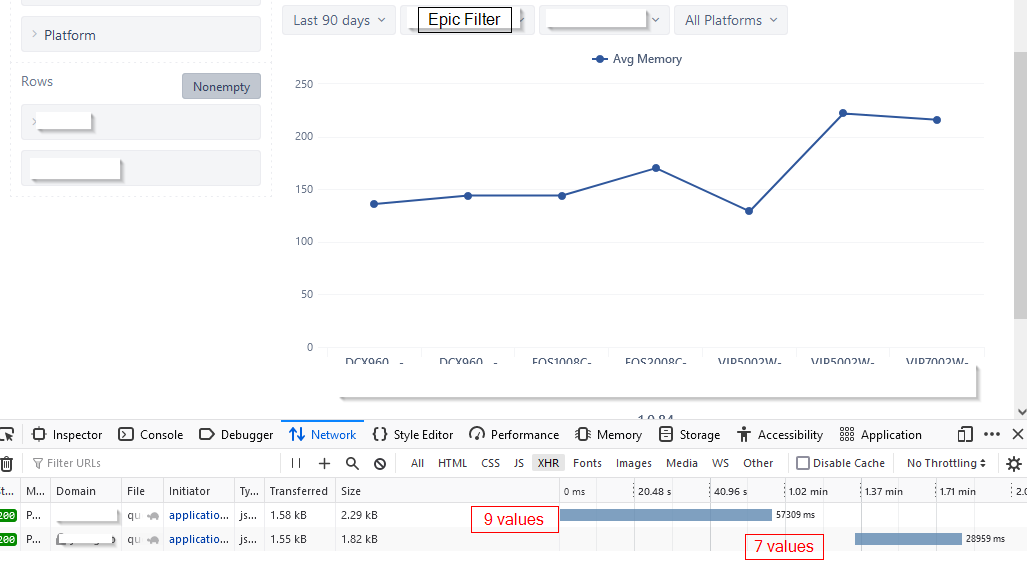
Here is example when I switch filter from Epic ‘A’ to ‘B’ and result is 9 and 7 values respectively:
Could you please suggest performance improvements on page filter or measure?