Hello!
I want to create a pie chart that shows the percentage of issues with a particular label & percentage of issues without that label.
In other words:
- all issues with Label1
- all other issues
The point is just to see what percentage of the whole has this label.
I am finding “all other issues without the label” part tricky – The “All labels” calculated member doesn’t work, because it includes Label1.
Any one know how I can do this?
Thanks!
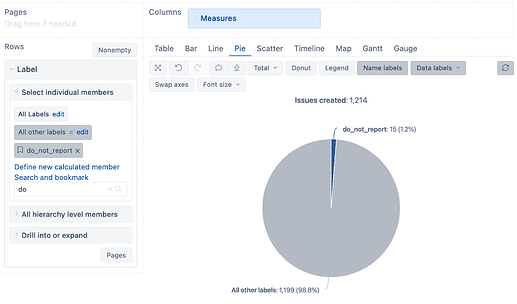
The simplest option would be using arithmetical calculations. I created a calculated member in Labels dimension subtracting a label from Label All labels (Label default member). I will use a label with a name do_not_report as an example:
[Label].DefaultMember - [Label].[do_not_report]
I called a new calculated member All other labels. Here I used it in the report together with the bookmarked label member. I used measure Issues created to count issues with a specific label and any other issue:
Daina / support@eazybi.com
