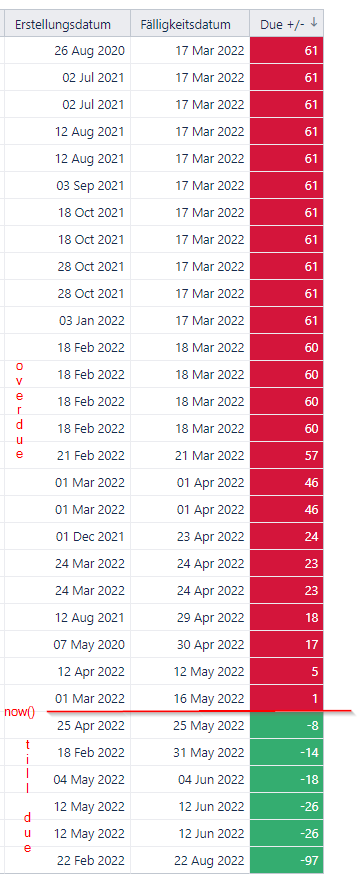
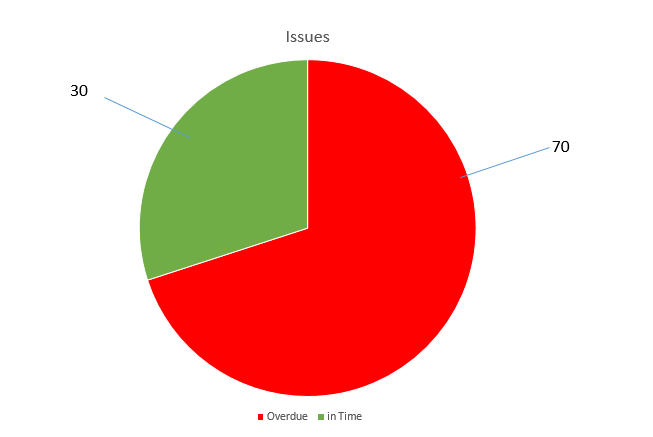
Hi Friends, i need a pie chart. for instance with 6 issues till a due date and 13 overdue. i have following table. i hope my explantion is clear ![]()
best regards
mario
Hi Friends, i need a pie chart. for instance with 6 issues till a due date and 13 overdue. i have following table. i hope my explantion is clear ![]()
Hi @slapshot,
Please visit the eazyBI Demo account. There you can find the report “Issues due and overdue” - Issues due and overdue - Issues - Jira Demo - eazyBI. The calculated measure “Overdue issues” will display the number of issues from the red part in your screenshot.
The calculated measure “Issues due in time” will display both resolved and unresolved issues that do not violate the due date. If you need only unresolved issues, see if you can alter the calculated measure on your own. Let me know if you get stuck.
That should allow you to create the desired pie chart.
Best,
Roberts // support@eazybi.com
Hi Roberts, sorry for late response. I mean more like the new screenshot. And only Issues with status not in resolved or closed.
Thank you,
Mario