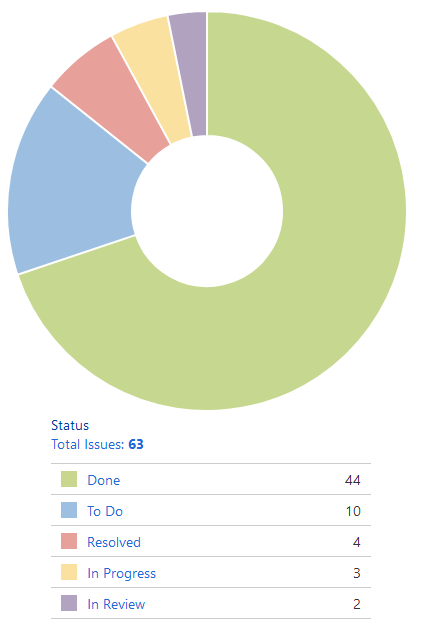
Hi all,
I would like to ask you how can I create pie charts where I can show status of all task or subtask and count of state or state where will be also number of hours for each part?!
Hi all,
I would like to ask you how can I create pie charts where I can show status of all task or subtask and count of state or state where will be also number of hours for each part?!
Hi @Marika,
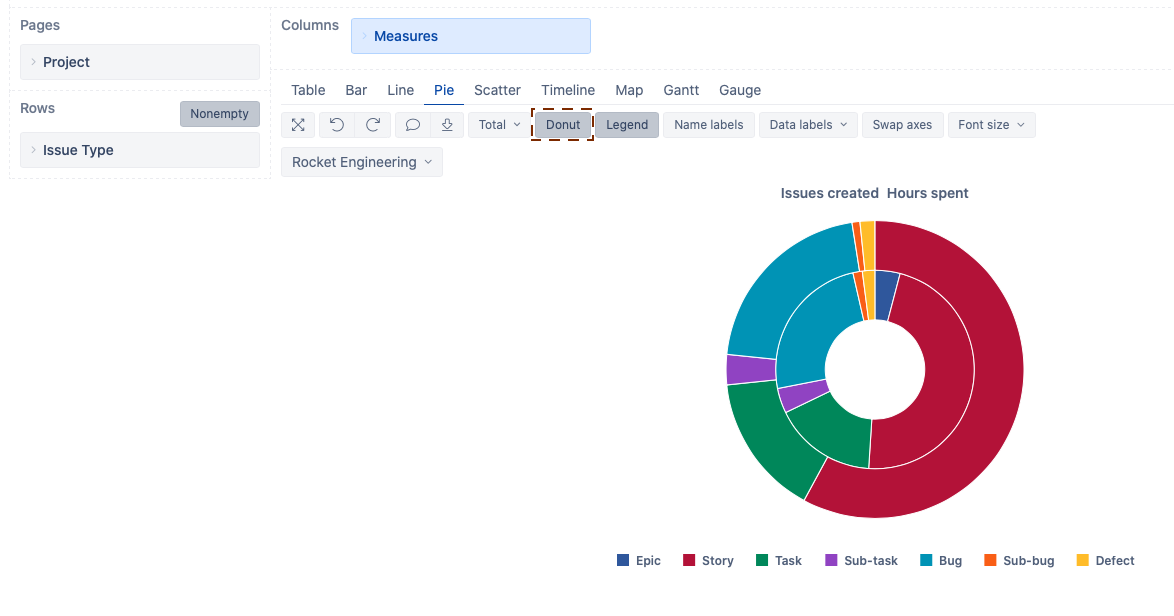
Try using the Issue Type dimension in rows, with the measures “Issues created” (number of issues for each issue type) and “Hours spent” (hours logged for each issue type). With two measures, the standard pie chart will display to pies. You can try the “Donut” option:
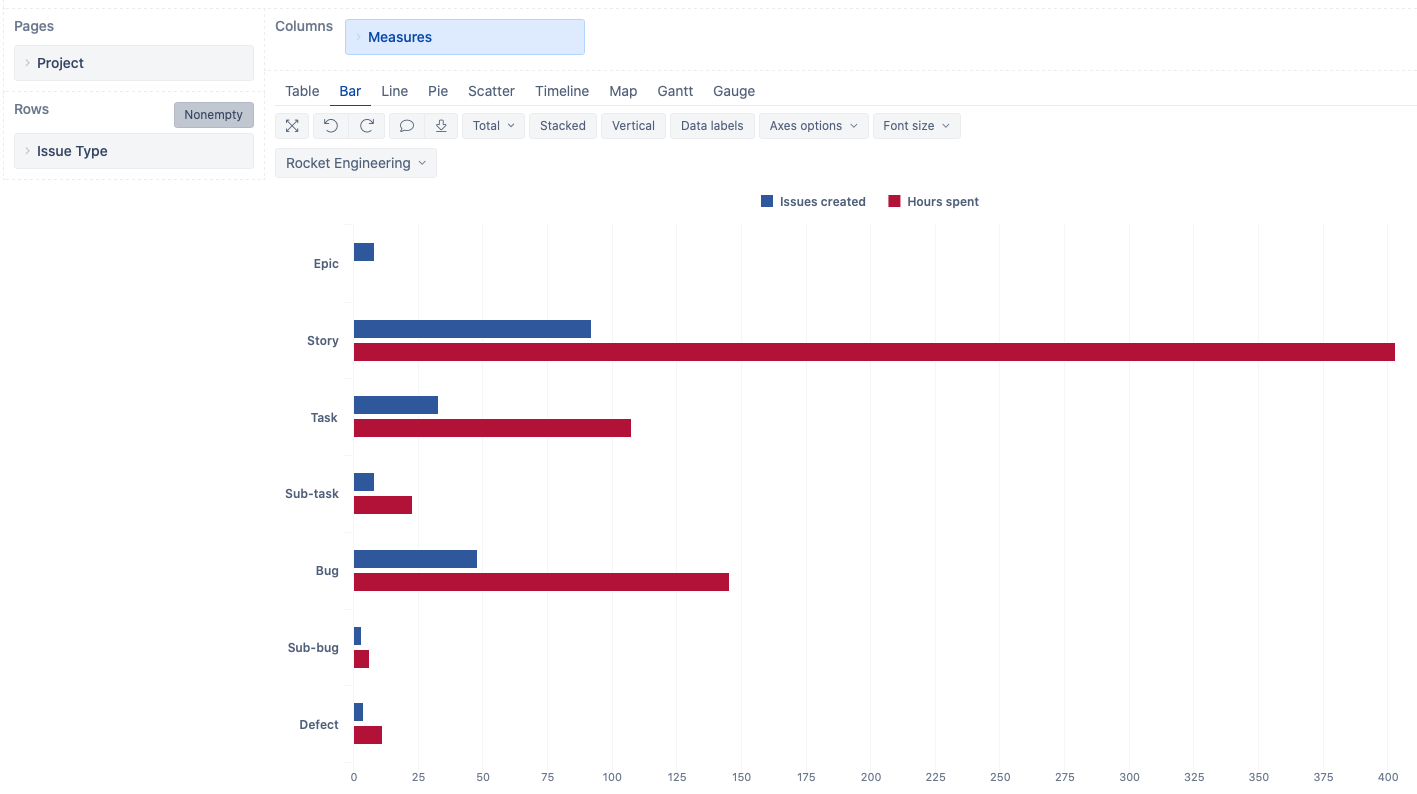
Nevertheless, I recommend using the bar chart for a better understanding of the data:
See the eazyBI documentation for more information on various chart types and ways to customize them - https://docs.eazybi.com/eazybijira/analyze-and-visualize/create-charts.
Best,
Roberts // support@eazybi.com