Hi my name is Patricio, I need please if you can help me with something that I have not been able to do.
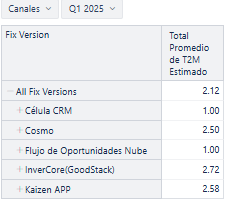
I need to get the total average, in this example it gives me 2.12 average in the header because it calculates all the release details of each project, but I just want to average the totals of the pivot table (1+2.5+1+2.72+2.58 = 1.96) so that this 1.96 is shown in a panel as a single value.
How do I want to show this value:

Is this possible?
Thank you very much for your help
Patricio
Hi @Patricio_Gonzalez
You may want to create a calculation that, for the All Fix Versions row, returns the average of Average resolution days for displayed rows, using ConstantColumnValue and VisibleRowsSet funcions, while the rest of the rows display the standard Average resolution days value.
The calculation would be the following:
Case when
  [Fix Version].CurrentHierarchyMember is [Fix Version].CurrentHierarchy.DefaultMember
THEN
 CASE WHEN NOT IsEmpty([Measures].[Average resolution days]) THEN
  ConstantColumnValue(CatchException(
    Avg(VisibleRowsSet(), [Measures].[Average resolution days])
  ))
 END
 ELSE
  [Measures].[Average resolution days]
end
Note: if you expand project-level rows, the average for the total row in this case changes.
Best,
Ilze, support@eazybi.com