hi
Is it possible to have planed star and finish and actual start and finish on same row at gantt chart
thanks
1 Like
Hi,
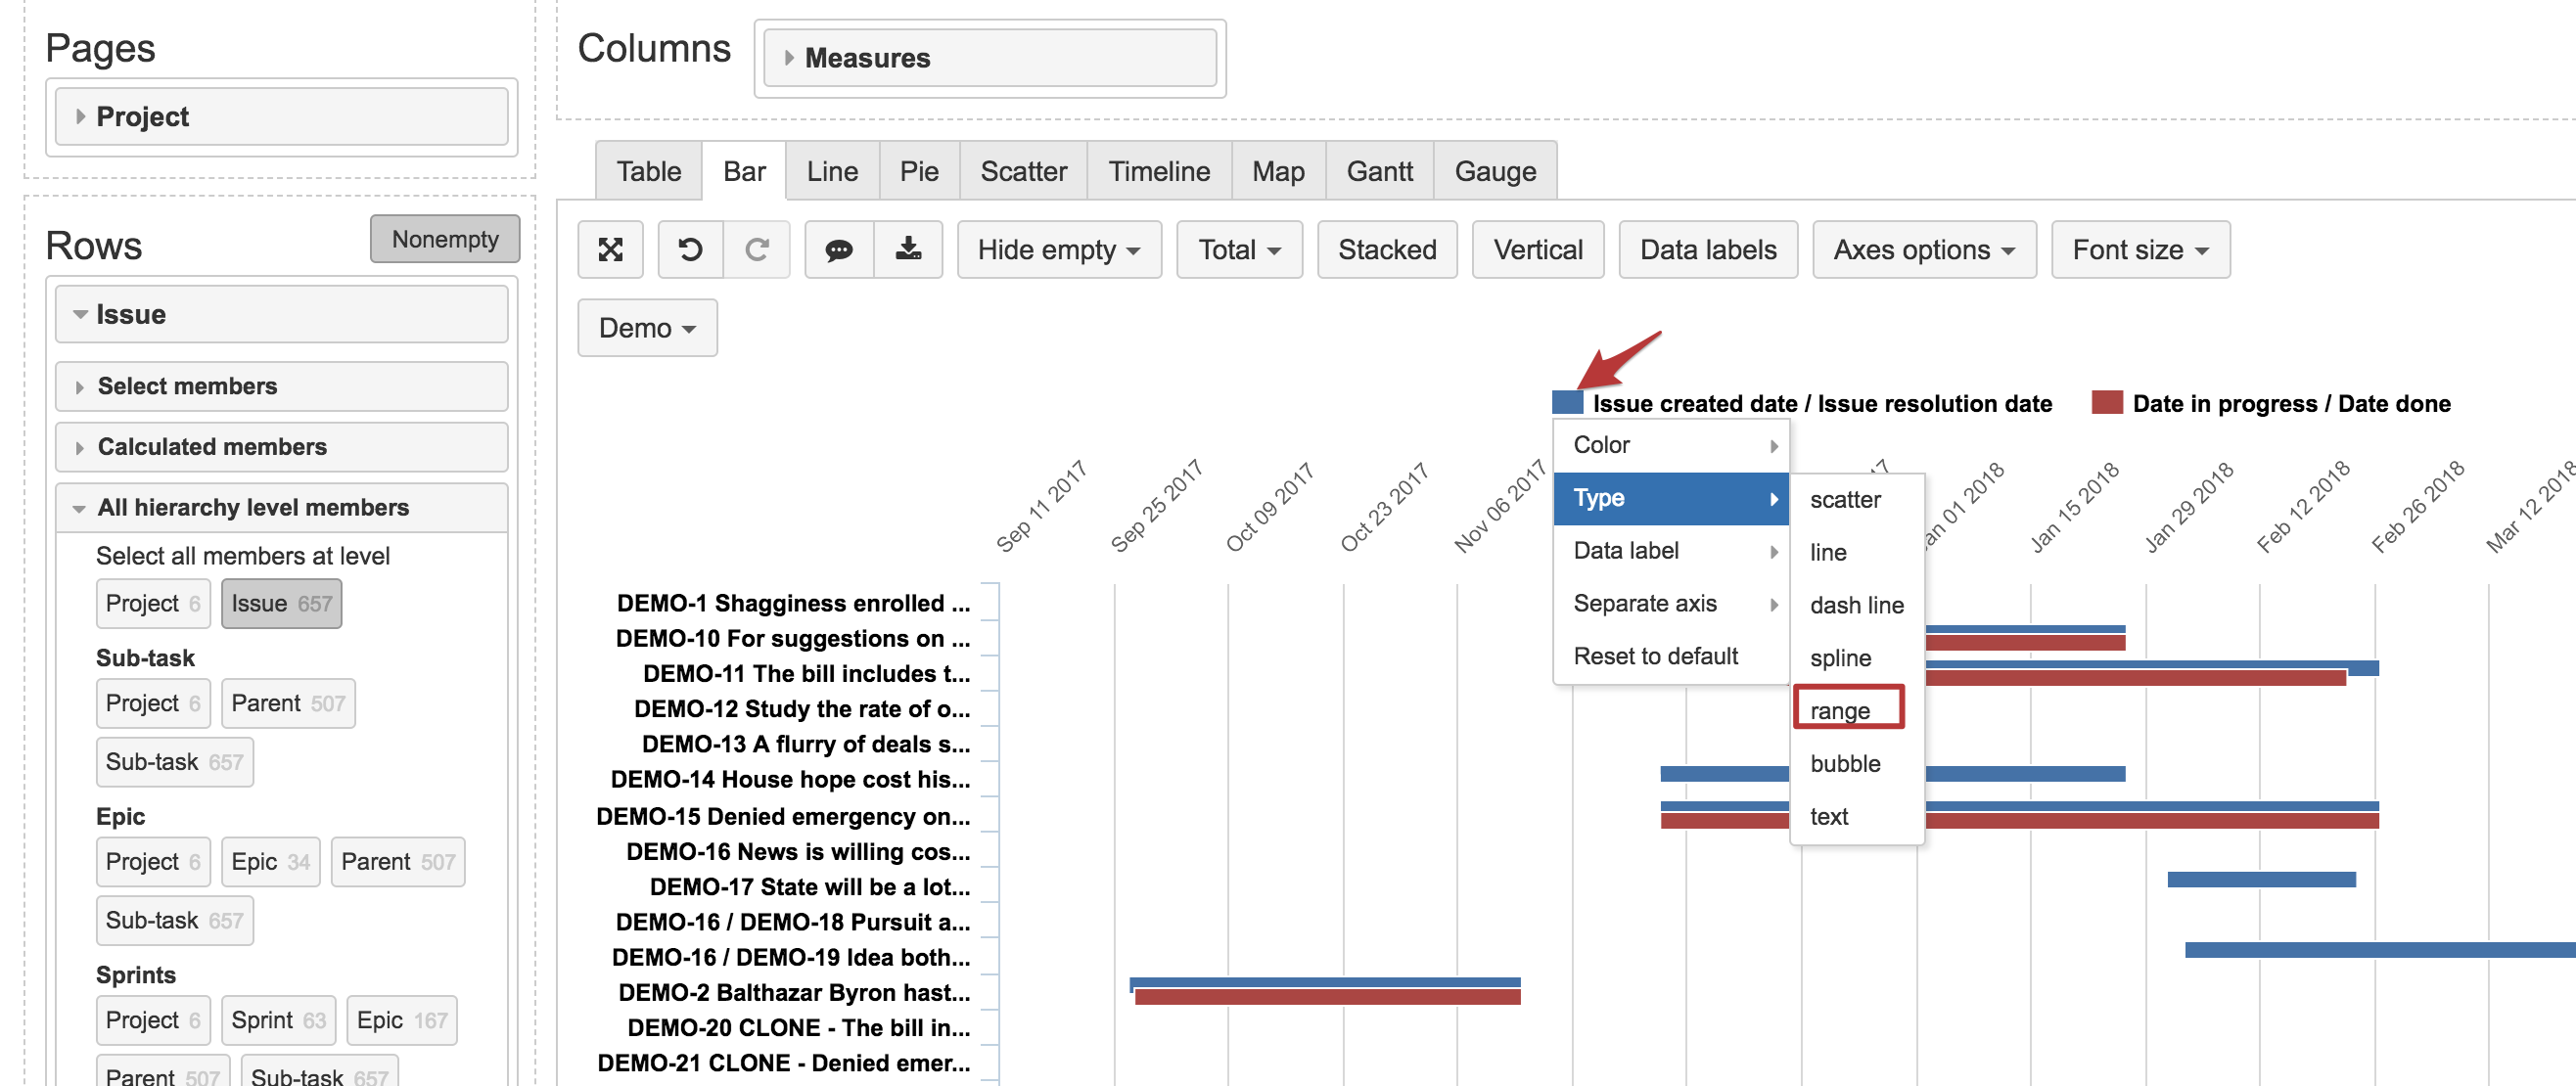
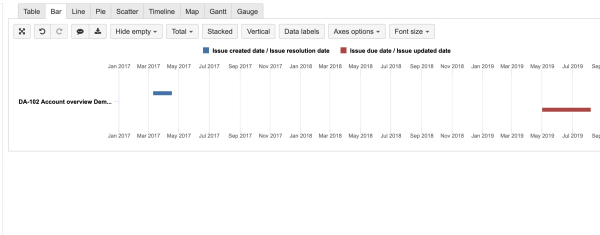
You can add several dates to the report, but only first two date columns will be used to show the bars in the Gantt.
There is, however, another option to show several date ranges by using the bar chart. You can add several dates in the report columns, switch the report to the bar chart view and select the “range” option for the date. That will generate the bars from the pairs of date columns.
Kindly,
Janis, eazyBI support
1 Like
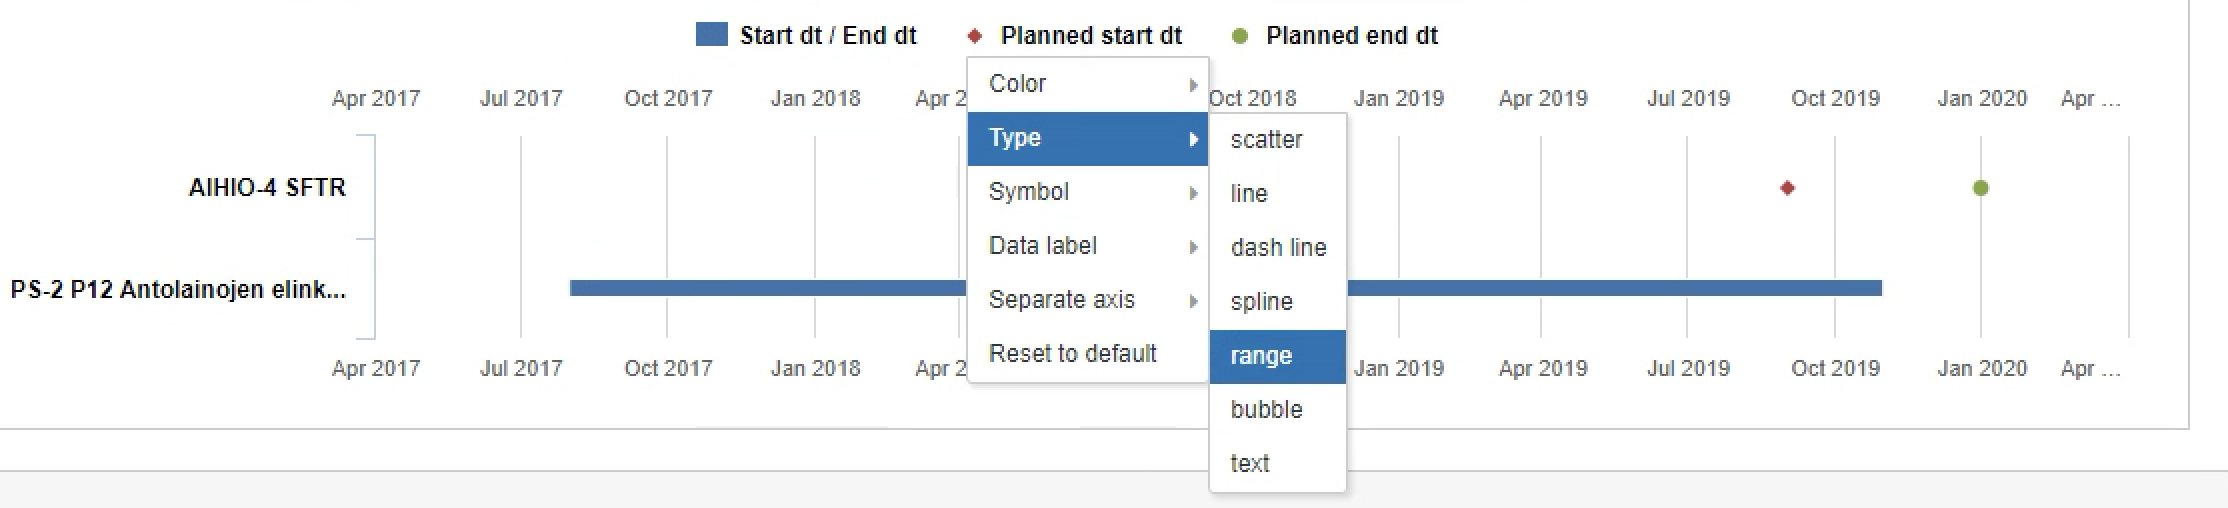
Can’t get this working. I have four date measures and if I switch it to range it does not pair the second pair. If I change the second pair individually to range nothing happens. EazyBi version 5.0
Hi,
It was a bug in previous versions of eazyBI and should now be fixed with the eazyBI version 5.0.3 for Jira Server:
It should work in the way that you select the “range” option for the first measure from the pair to draw the Time bar.
Kindly,