Hello EazyBI Community,
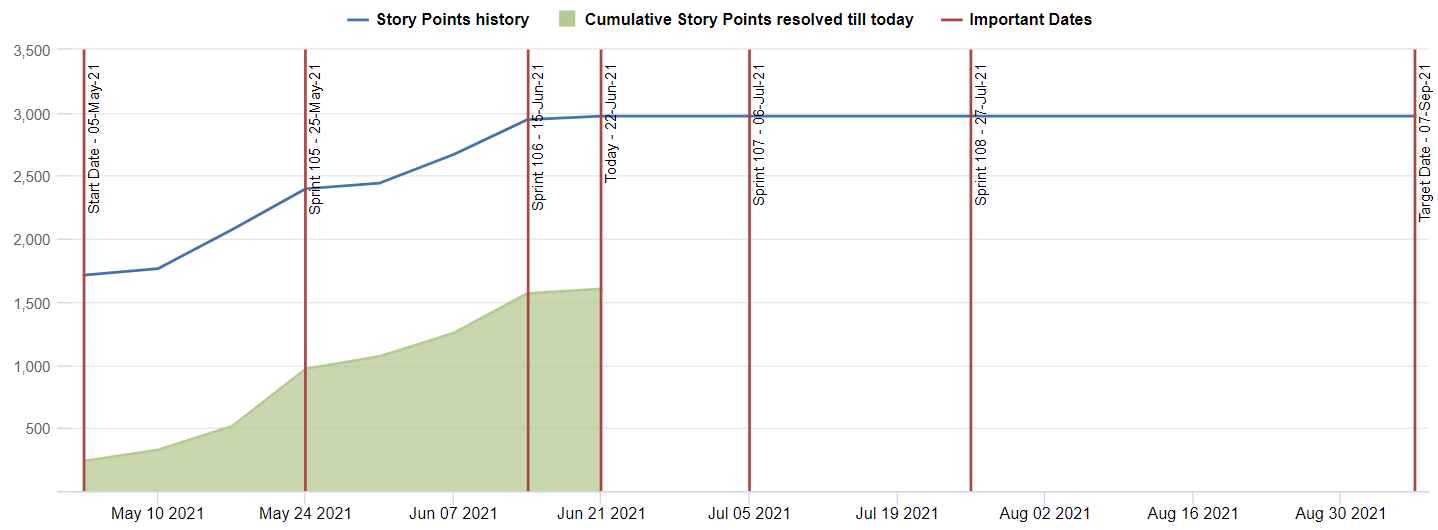
I have created a custom chart using help from your demo charts available for Version Report. I was able to create successfully the below chart with custom start date & end date:
I still need few other things on this chart:
-
A prediction line based on past 5 sprints running velocity but with the dates I provide i.e. Version Start date & Version End date are not available from Jira. It should pickup from the Important dates measure or maybe pickup the date from 1st sprint start date of the release.
-
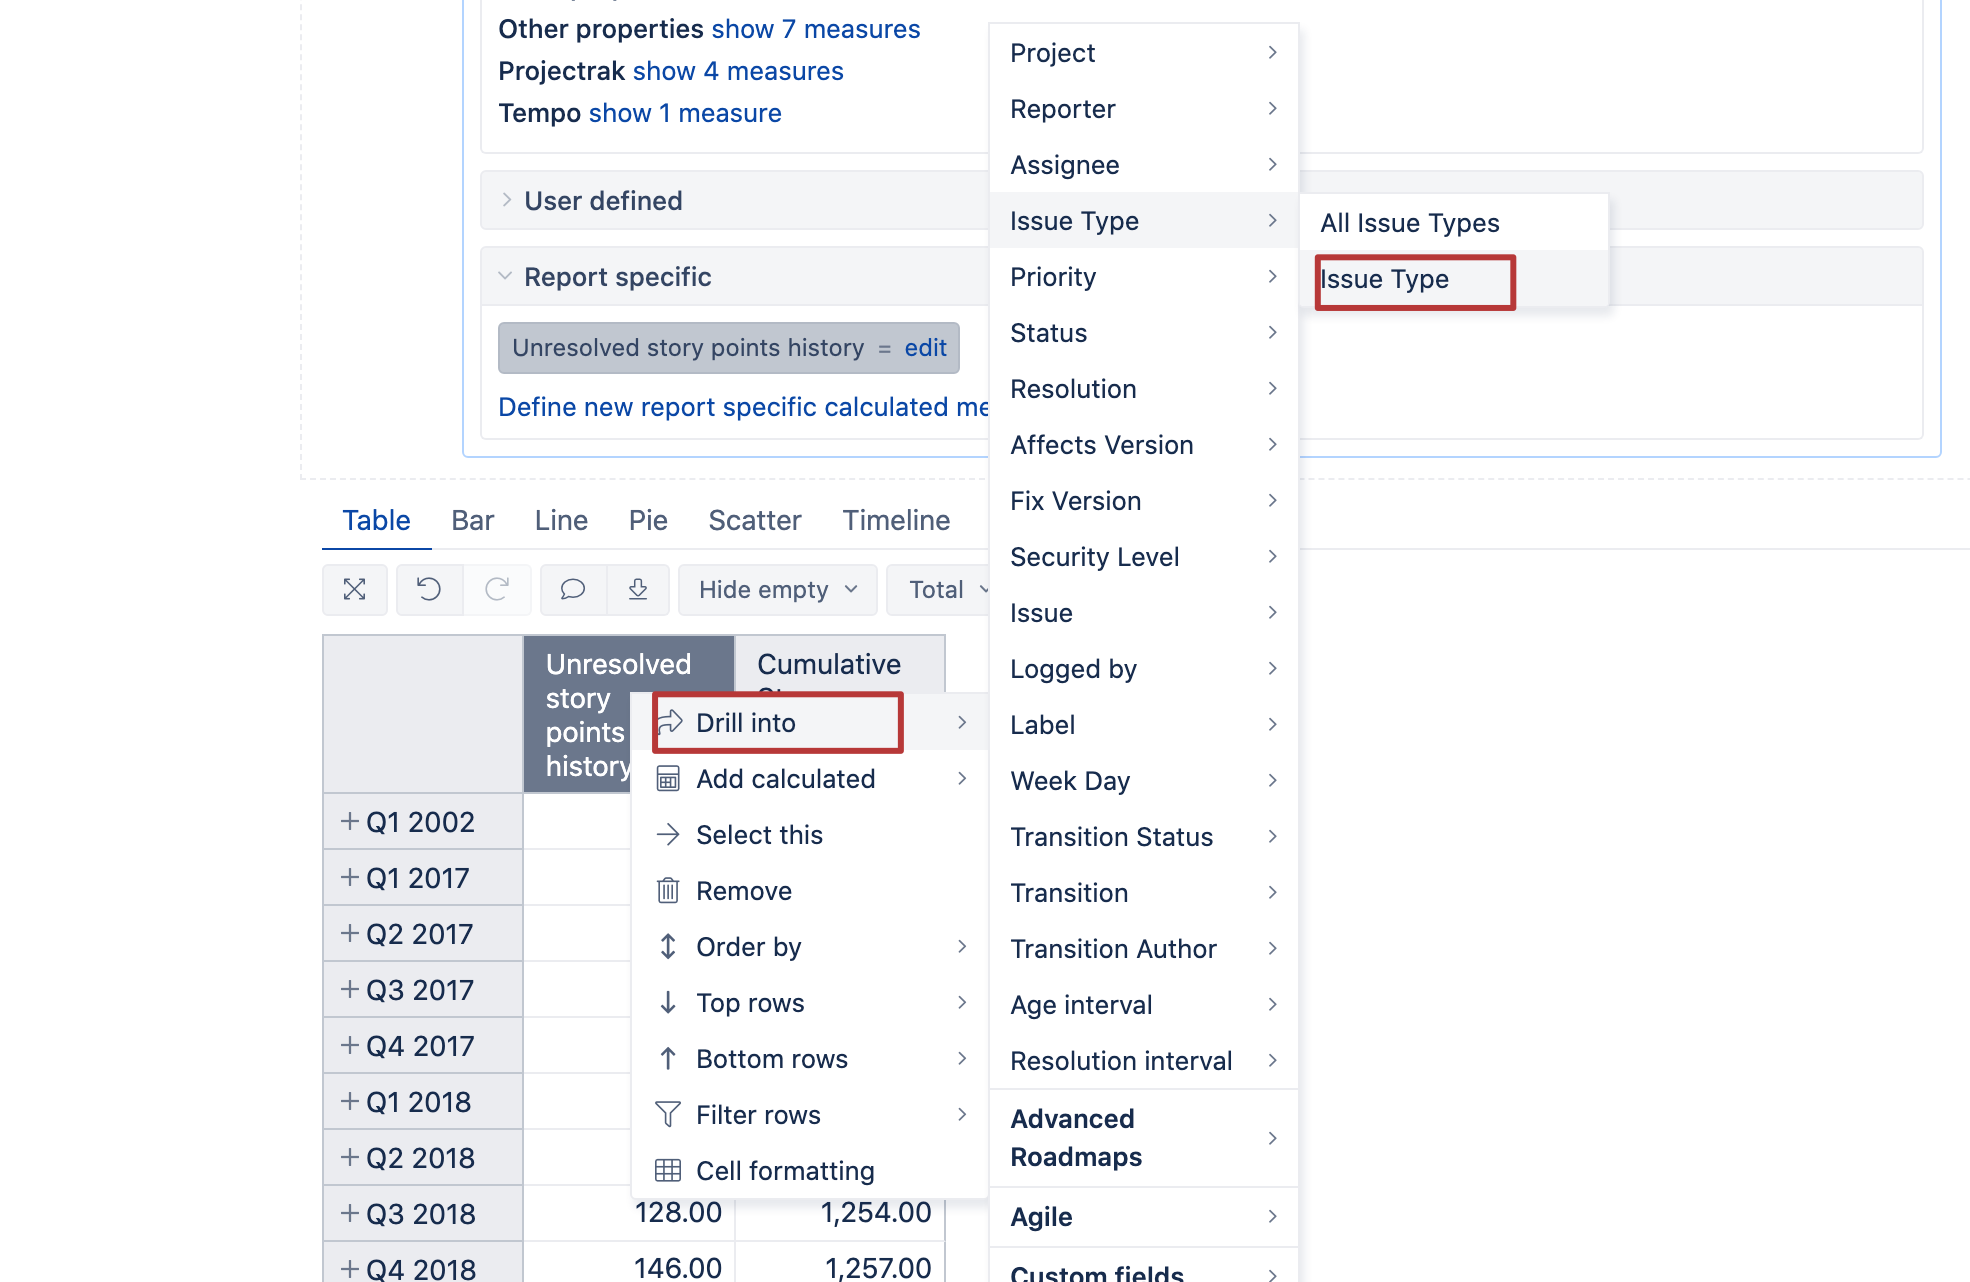
Additionally can I have the breakup of the Story Points history line into Epics/Stories/Bugs created? As it is evident that the story point history line is also growing with resolved one. I need to understand how many Epics, stories & bugs were there at the start of the Release & how many did we create as time progressed on the graph.
Any help would be greatly appreciated. Thanks in advance.