Dear Team,
We really like the History of issue Statuses chart, we find it incomplete, we always have to look for Issues created & resolved trend separately.
Is there some way that I can add this as a trend line? I have tried to do it, but the issues created does not show as a legend.
I am guessing, I have made a mistake.
Can you please help?
In the upcoming eazyBI version 5.0, we will add automatic calculations to the reports so that users can write less MDX and get the calculations they require. These will include the calculations of trend lines of the currently visible values. We are planning to release this version sometime around the end of June 2019.
The automatic calculations will be available under the same menu as ordering and filtering of measure values, please have a look at the picture below:
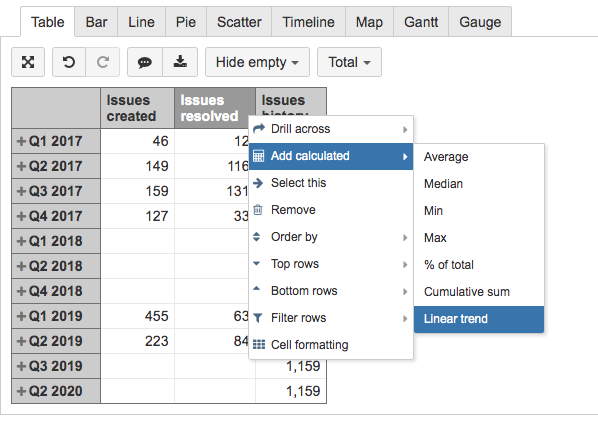
If you need the calculation for the linear trend sooner rather than later, please try to get familiar with the LinRegPoint() function - https://docs.eazybi.com/eazybi/analyze-and-visualize/calculated-members/mdx-function-reference/linregpoint. You can also have a look at our demo account where this function has been used to create linear trend calculations. For example, this report displaying the trend of average resolution days - https://eazybi.com/accounts/1000/cubes/Issues/reports/155045-average-resolution-lead-time-and-trend.
Kind regards,
Roberts // eazyBI support
Just an update:
You can check eazyBI documentation on how to add linear trend to the report (as well as other standard calculations) - https://docs.eazybi.com/eazybijira/analyze-and-visualize/create-reports#Createreports-Addstandardcalculationsbasedonaselectedmeasure
best,
Gerda // support@eazyBI.com