hi
I have a first column in the table that actually returns “issues.created”.
From this column I created the second column that shows the percentage.
From the second column I created the third with the bar sparkline feature.
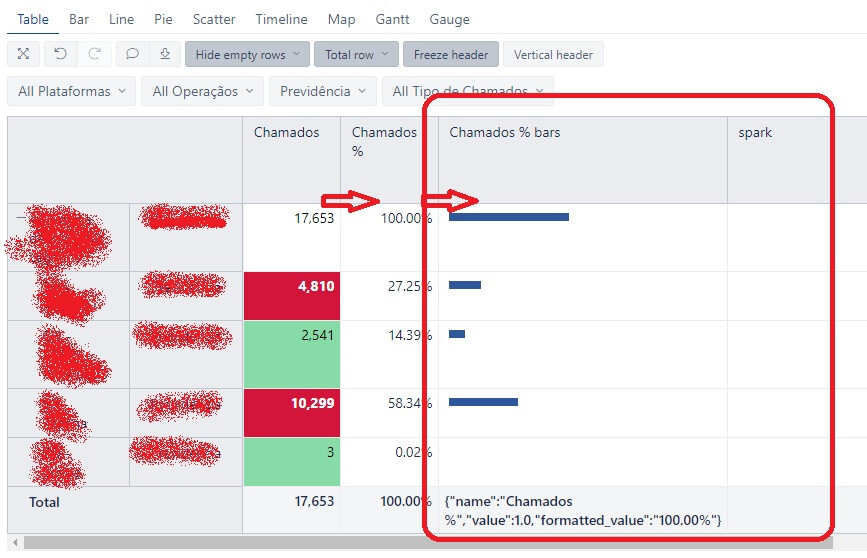
My first problem is that on the total line an error message is being shown instead of showing the 100% bar it is being shown.
Then I tried to create a new measure of the bar sparkline type with the same code/formula used in the automatic sparkline column (SparklineData([Measures].[Chamados %])) .
My second problem is to understand why my measurement doesn’t show anything.
If my first problem is solved, I don’t need a solution for the second one, because I don’t need the measure anymore.
Thanks