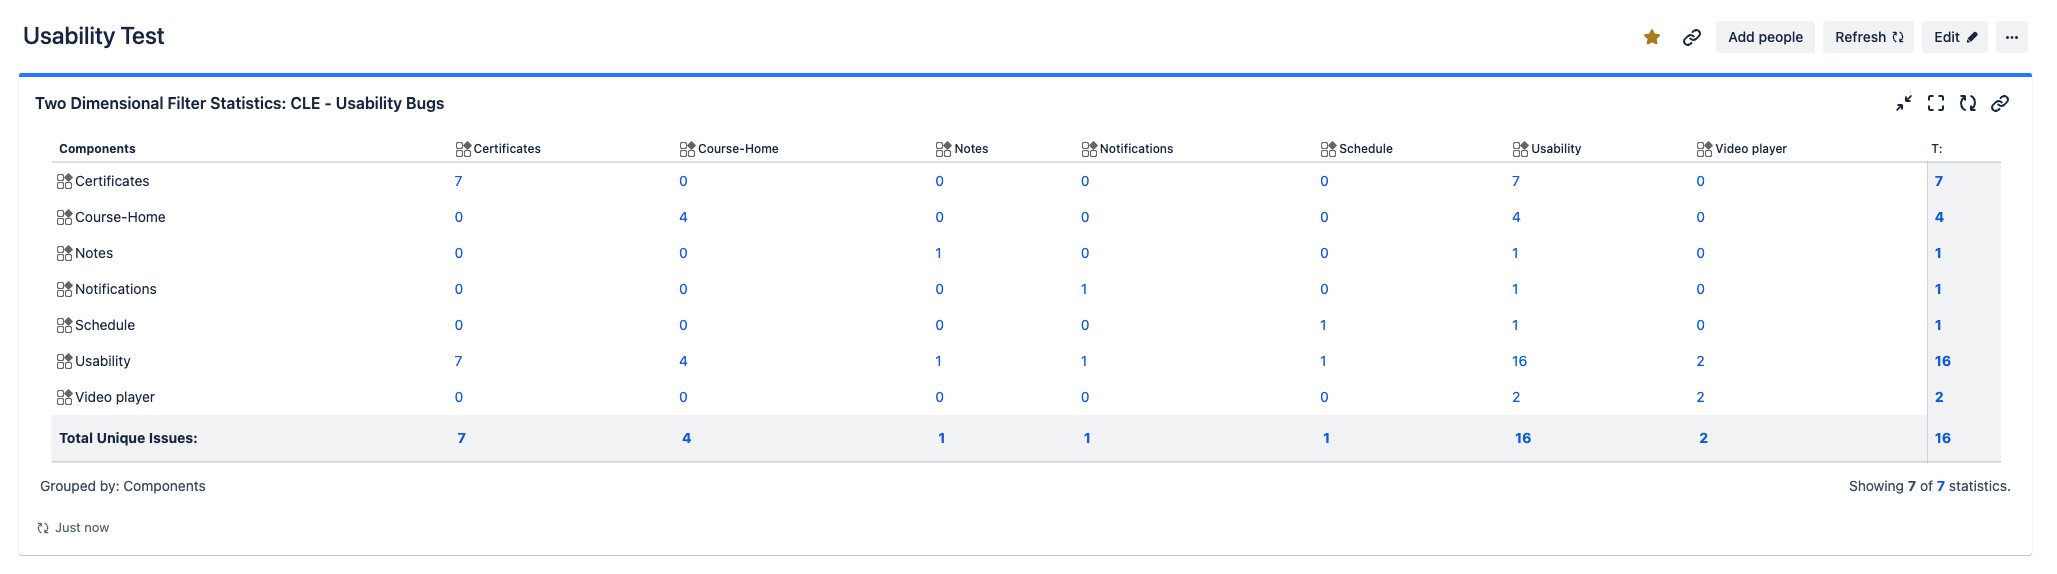
I want to create a matrixed report of components. For any given project I would like to show a table that is a matrix of all issues with component = usability and then the other components applied to that issue and a count. I am able to do this with native jira report (see screen shot) but am struggling to recreate this in EazyBi.
How do I create a column dimension that lists components so that the matrix or 2-dimensional view can be created?
Hi @Elizabeth_Jones,
For a matrix report, eazyBI requires another Component dimension. I recommend defining a new JavaScript calculated field for that. Please see an example here - Dimension Component as filter - #4 by zane.baranovska and here - JavaScript calculated custom fields.
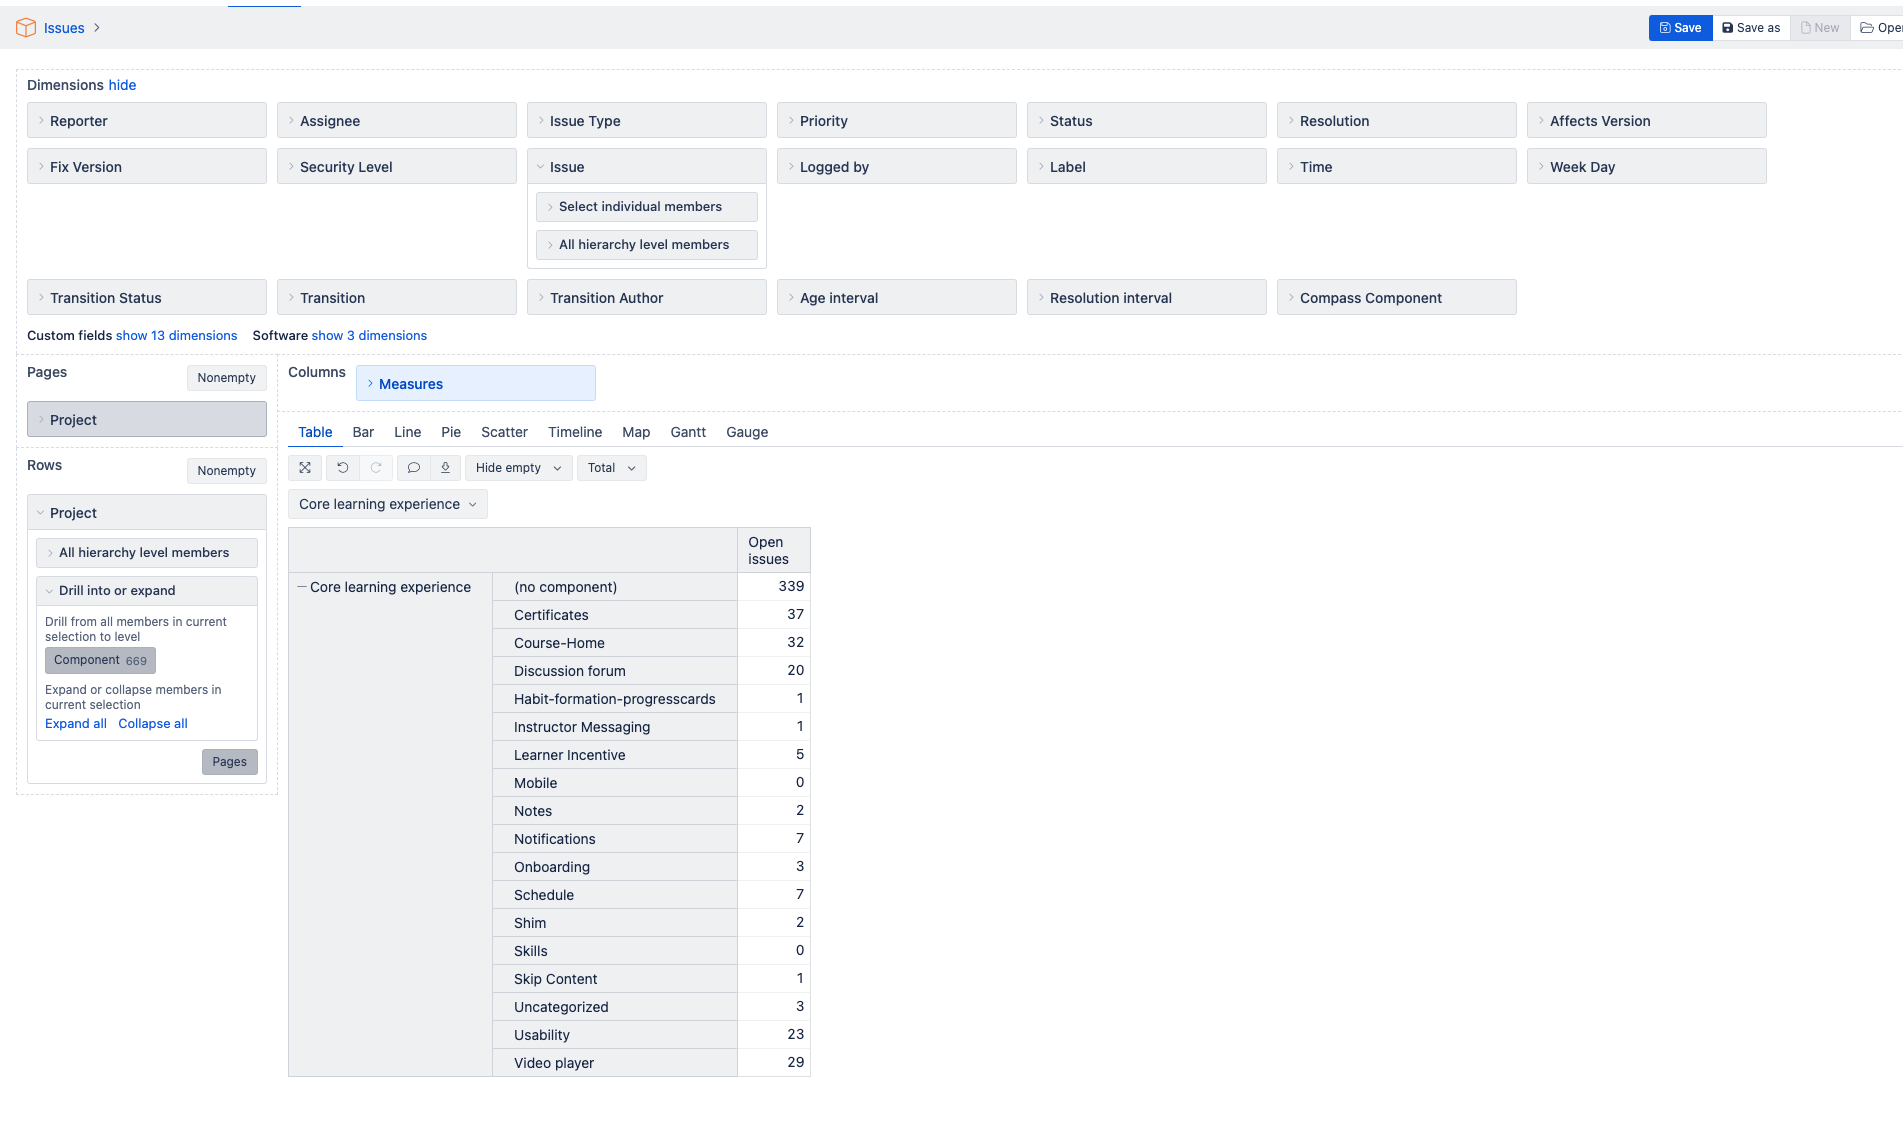
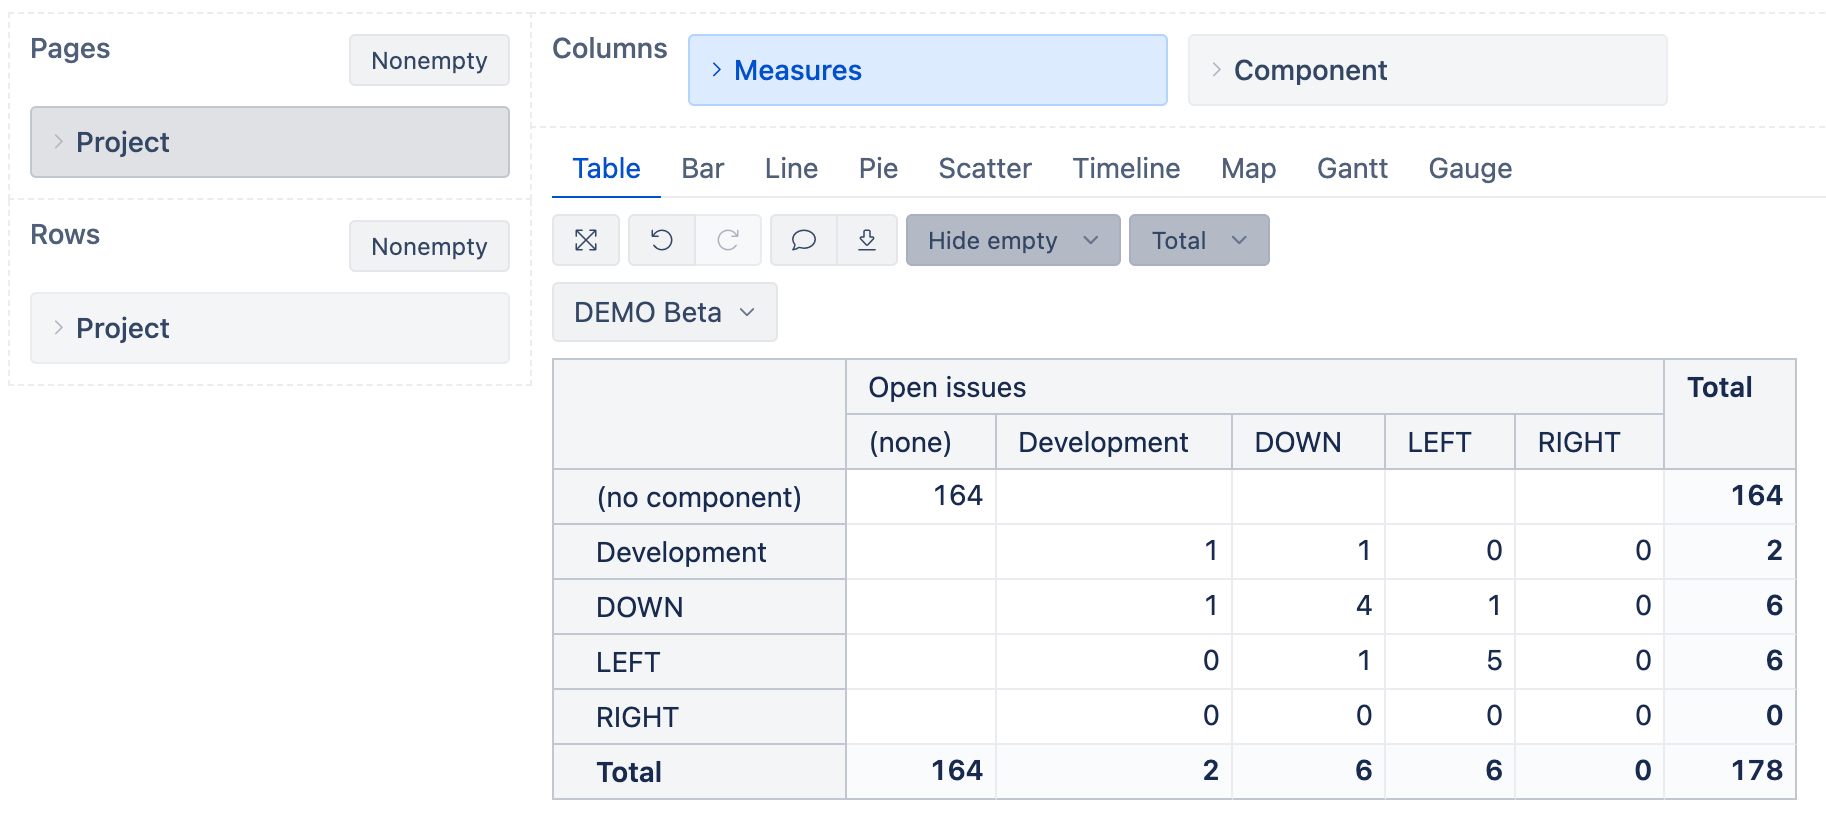
After that, you can use the Project dimension in report rows and pages. The new Component dimension in columns. The report could look similar to the one below:
One additional problem that will arise with “Open issues” is when adding the “Total” rows and columns. The total will add all issues, where the total of both rows and columns will be a sum of values instead of the actual issue count. This tends to happen with multi-value fields. I recommend defining a new calculated measure to retrieve the distinct count of open issues. The formula could look similar to the one from the following community post - Open issues for a suset of components - #2 by roberts.cacus.
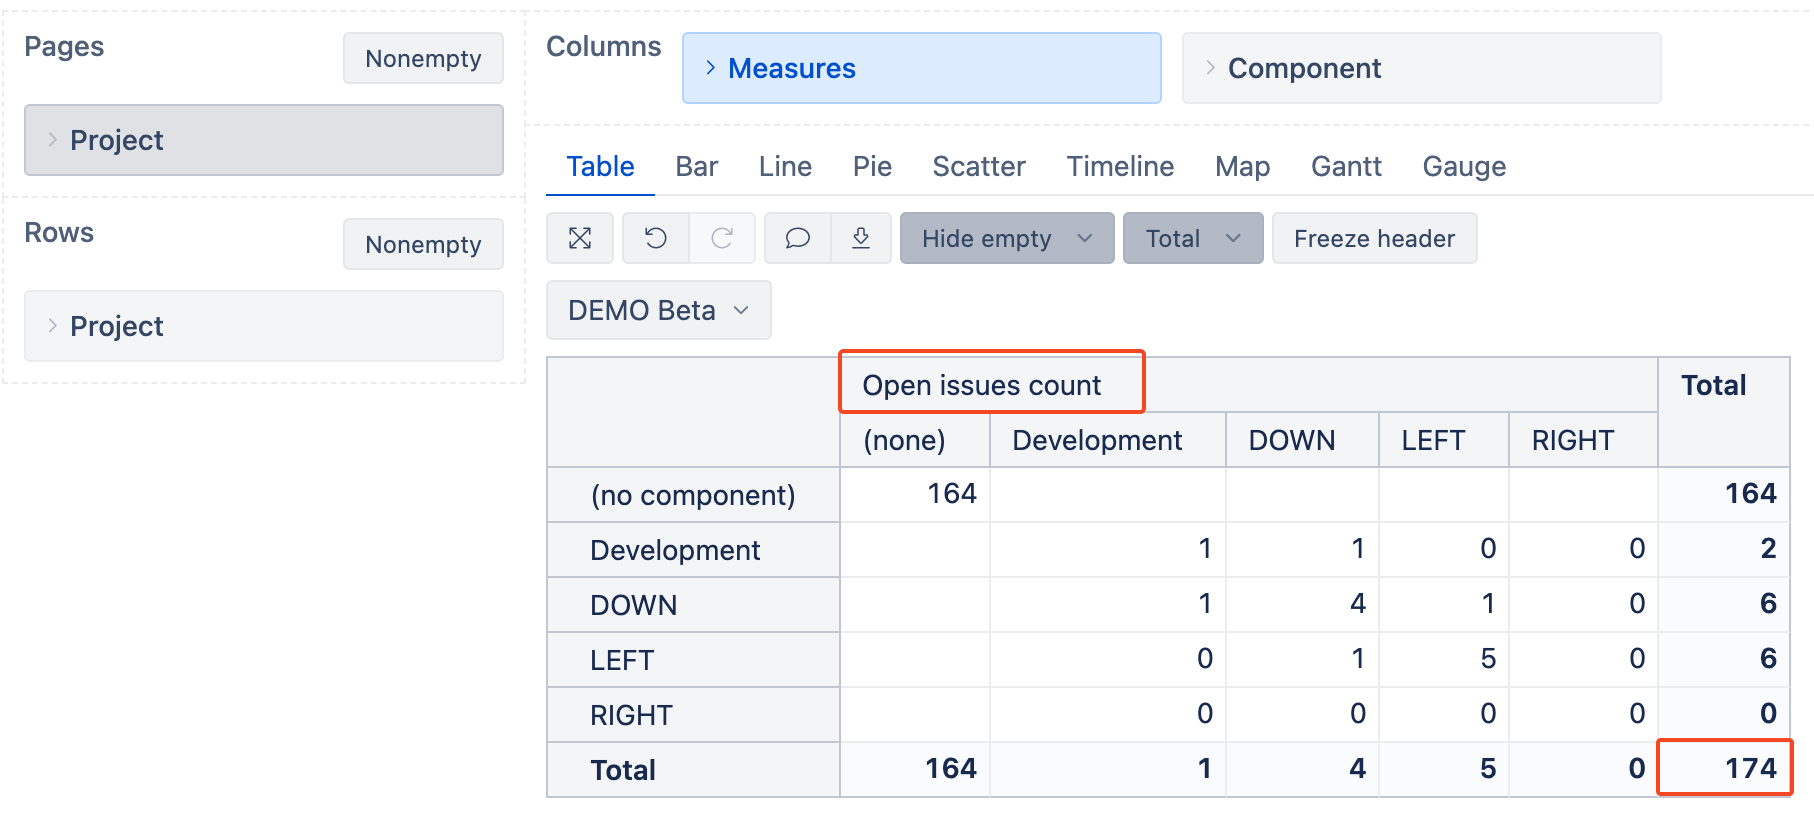
With it, the report could look slightly different in the “total” department:
Best,
Roberts // support@eazybi.com