Hello everybody,
I am very new to the EazyBI. Just started to underestand a little bit how it works.
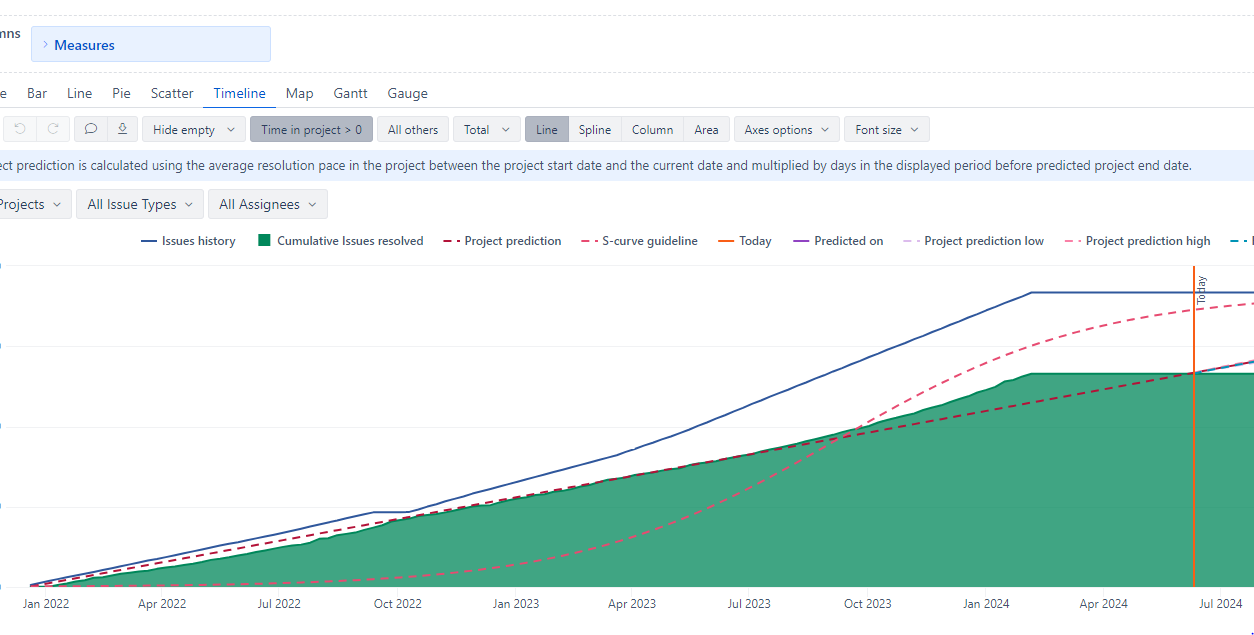
On the eazyBi demo account there is the “Project Prediction report”. I imported it, it shows great but i can not see past the 03 June. The Today orange bar is not available. I haven’t changed anything in the filters.
Demo:
Thank you very much for your help,
Stefan
Is it possible that the diagramm does not show the actuall Today but the Today represents the day when the last modification was made in the project ?
Hi @Stefan1,
A warm welcome to the eazyBI community  !
!
The report depends on the Time dimension members imported into the particular account. eazyBI generates the Time dimension members when particular dates in issues are present, either from system fields (created, resolved, due), changelog actions (status transitions, issues updated), or custom date fields.
Could it be the case, that your Jira data doesn’t contain data past June 3rd? If so, you can mitigate that by generating Time dimension members - Time dimension.
Best,
Roberts // support@eazybi.com
1 Like
Thank you Ropbert !
Actually the “today” is the week where changes were made the last time.
The graph calculates per week incrementation !
Everything is ok !
1 Like