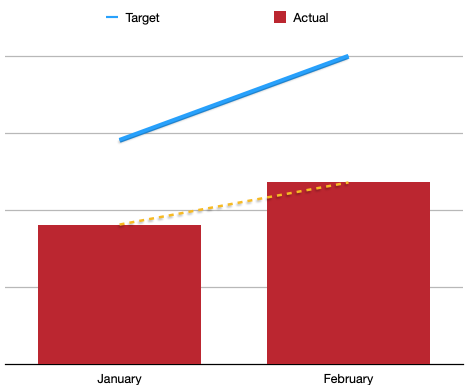
I am trying to build a dashboard that shows sales actuals YTD against monthly targets. There will also be a linear projection line based on the YTD actuals. However, when creating this graph. The linear line will only go as far as the current month even when the entire year has been chosen for data range as there are no actuals in other months.
Whereas I would want the entire year’s projection and target to show even if there are no actuals to show in those months
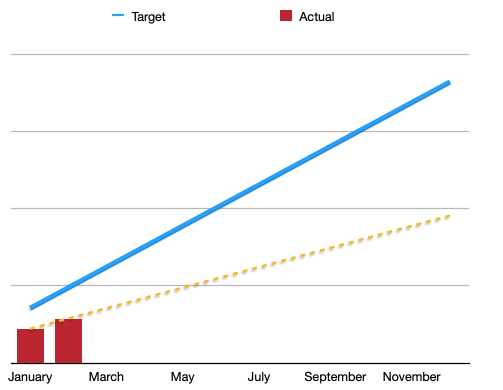
By default, eazyBI is adding members to the Time dimension only if there is some activity on that date. Future dates often are not added as the only action that usually is in the future is the Issue due dates or Sprint end date. In some cases, some past dates also could be missing due to the lack of activity per day.
For the year 2022, the format would be “2022-01-01 and 2022-12-31”. This will add the missing members to your Time dimension and when you disable the Nonempty function for Rows you will be able to see the empty months in your report.