Hello, everyone
I’m having trouble putting the total hours in a month on my time tracking report. Let me explain the situation.
I’m using the Logged hours by user in current week sample, from the time tracking samples, as a base and I changed the time to give me the month hours spent by user and by project.
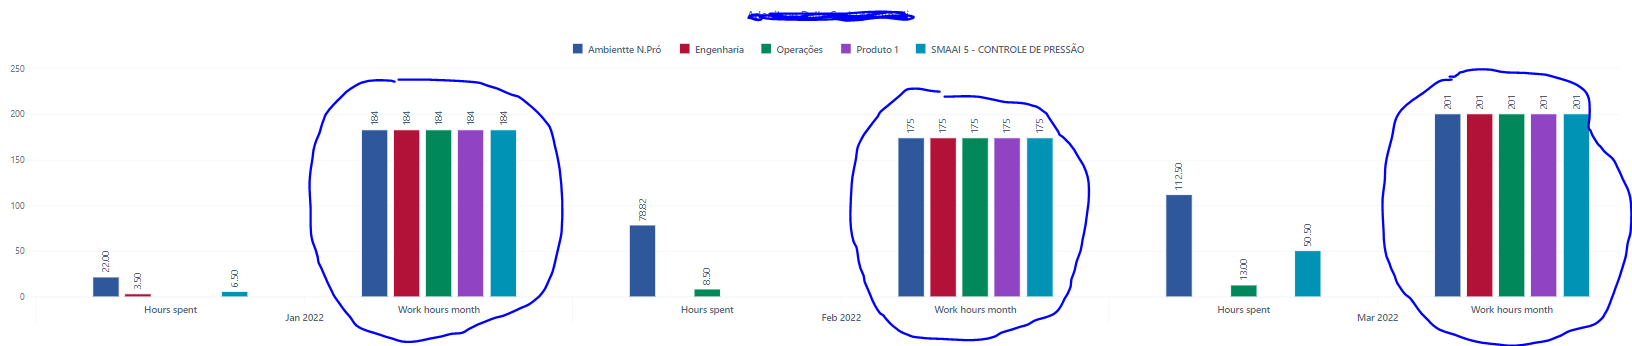
Then I created a calculated measure to give me the total hours from workdays (multipling the workdays on the month by the amount of hours we do), and used this measure (184 hours in january, 175 in february and 201 in march)
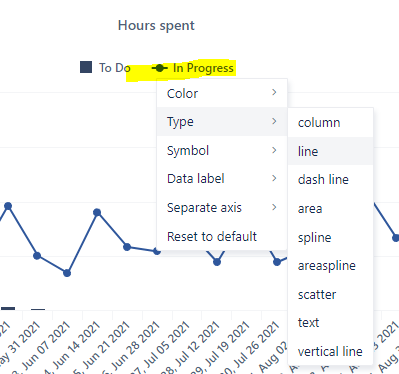
Problem is, when i put it in the bar graph, all the total hours become a bar:
And instead I wanted it to be displayed as a line or as an area above the Hours spent measure.
Is there as easy way to make this happen?