Hello, I am trying to get the average cycle time for epics or stories, being that the average time spent in a specific set of statuses, and I ended up looking at the following example I have seen in other posts:
https://eazybi.com/accounts/1000/dashboards/7513-age-lead-and-cycle-time
I saw there " Average days in cycle shows an average of total time spent issue spent in is specified statuses represented by Transition status dimension", which does what I need when I calculate the total cycle time. I have another need that is to show that total split into the different statuses (stacked bars with the average for each of the statuses that makes the total). The problem I have with that is that the averages are calculated based on the number of issues that have been in that specific status instead of the total number of issues, so averages of different statuses are calculated on a different number of epics/stories. That happens because we have some statuses that are not mandatory, so not all issues go through them. Issues not going through a specific status would contribute 0 to the total time spent in that status, but they would contribute to the count of issues considered for the average.
I would need to calculate the averages for different statuses on the total resolved issues in the period instead of on the number of issues that have gone through that specific status, how could I achieve that?
Thanks in advance for your help
Yes, you are correct. Measure Average days in cycle works only for issues that had some time in the status only.
Here I updated the same formula. I used only issue-level calculation for this one. I used 0 with the function CoaleseceEmpty to count in all resolved issues even they do not have any time spent in the status.
NonZero(AVG(
  Filter(
    Descendants([Issue].CurrentMember, [Issue].[Issue]),
    -- filter issues resolved in period
    DateInPeriod(
      [Measures].[Issue resolution date],
      [Time].CurrentHierarchyMember
  )),
  CASE WHEN
   -- filter currently resolved issues by any dimension, except transition status
    ([Measures].[Issues resolved], [Transition Status].CurrentHierarchy.DefaultMember) > 0
  THEN
  -- count total time spent for this issue in a particular status - use Transition status in report
    CoalesceEmpty(
      DefaultContext((
       [Measures].[Days in transition status],
       [Issue].CurrentMember,
       [Transition Status].CurrentHierarchyMember, -- use Transition status in report or in another formula or use 0 if issue was not in the status
       [Status.Category].[Done]))
    ,0 )
  END
))
Daina / support@eazybi.com
Thank you Daina, that is very helpful. The last detail I have found is that, when we apply a time filter, even if we are going to issue level, that time filter is also applied to transitions. That means, we can have issues where not all their transitions are considered in the calculation of their cycle time, which is not what I would expect. How could we include all the transitions of all the issues that have been resolved in the period? (Or alternatively consider only issues where all their transitions are in the selected period if what I am asking is not possible)
An example of what I’m describing could be:
Issue1:
- Transition 1 from To Do to In Progress on the 5th of May.
- Transition 2 from In Progress to Under Review on the 8th of May.
- Transition 3 from Under Review to Done on the 10th of May.
Time Filter: 9th May, 10th May, 11th May
The cycle time calculated for Issue 1 would be only the time spent in Under Review (2 days), given Transition 1 is not in the selected period, while the actual cycle time for that issue (considering In Progress + Under Review the statuses we want to measure) should be 5 days (days In Progress + Days Under Review). That affects the accuracy of the measures we are getting.
Thank you again for your help!
The formula I shared should count an issue once - in the period of the issue resolution. It should also take into account the total time an issue spent in any specified statuses for those resolved issues.
Here I am adding more details on how the formula works:
  NonZero(AVG(
  Filter(
    Descendants([Issue].CurrentMember, [Issue].[Issue]),
    -- when used with Time dimension it will filter issues by resolution date in period
    DateInPeriod(
      [Measures].[Issue resolution date],
      [Time].CurrentHierarchyMember
  )),
  CASE WHEN
   -- this is additional filter to filter resolved issues only. This filter uses measure and will check if issue should be counted for any selected dimension, except transition status
    ([Measures].[Issues resolved], [Transition Status].CurrentHierarchy.DefaultMember) > 0
  THEN
  -- this tuple should take into count Transition status used in the report
 -- if Transition status dimension is not used in the report, change the transition status and replace [Transition status].CurrnetHierarchy member with a calculated member representing all the needed statuses
    CoalesceEmpty(
      DefaultContext(( -- default context will ignore any dimension in the report, including Time. It will take into account only listed members
       [Measures].[Days in transition status],
       [Issue].CurrentMember,
       [Transition Status].CurrentHierarchyMember, -- use Transition status in report or address a particular Transition status/calculated member here
       [Status.Category].[Done]))
    ,0 )
  END
))
If you would like to count a cumulative count of days in the status, it might be a much more complicated formula and might fail to load in many reports/accounts.
Daina / support@eazybi.com
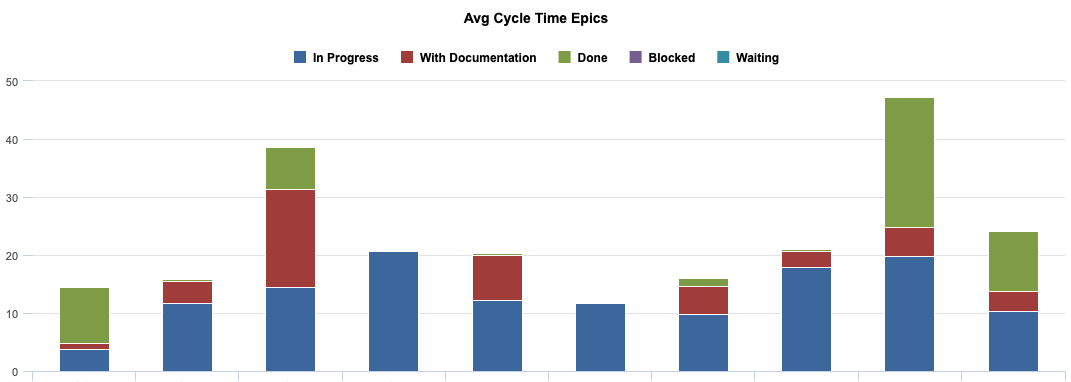
Thank you again. What I try is to show a stacked bar where, with just one look I can see the total average cycle time (total height of the bar) and each part of the bar shows the average time in each specific status, for different teams. Like the following image:
The idea is to detect bottlenecks.
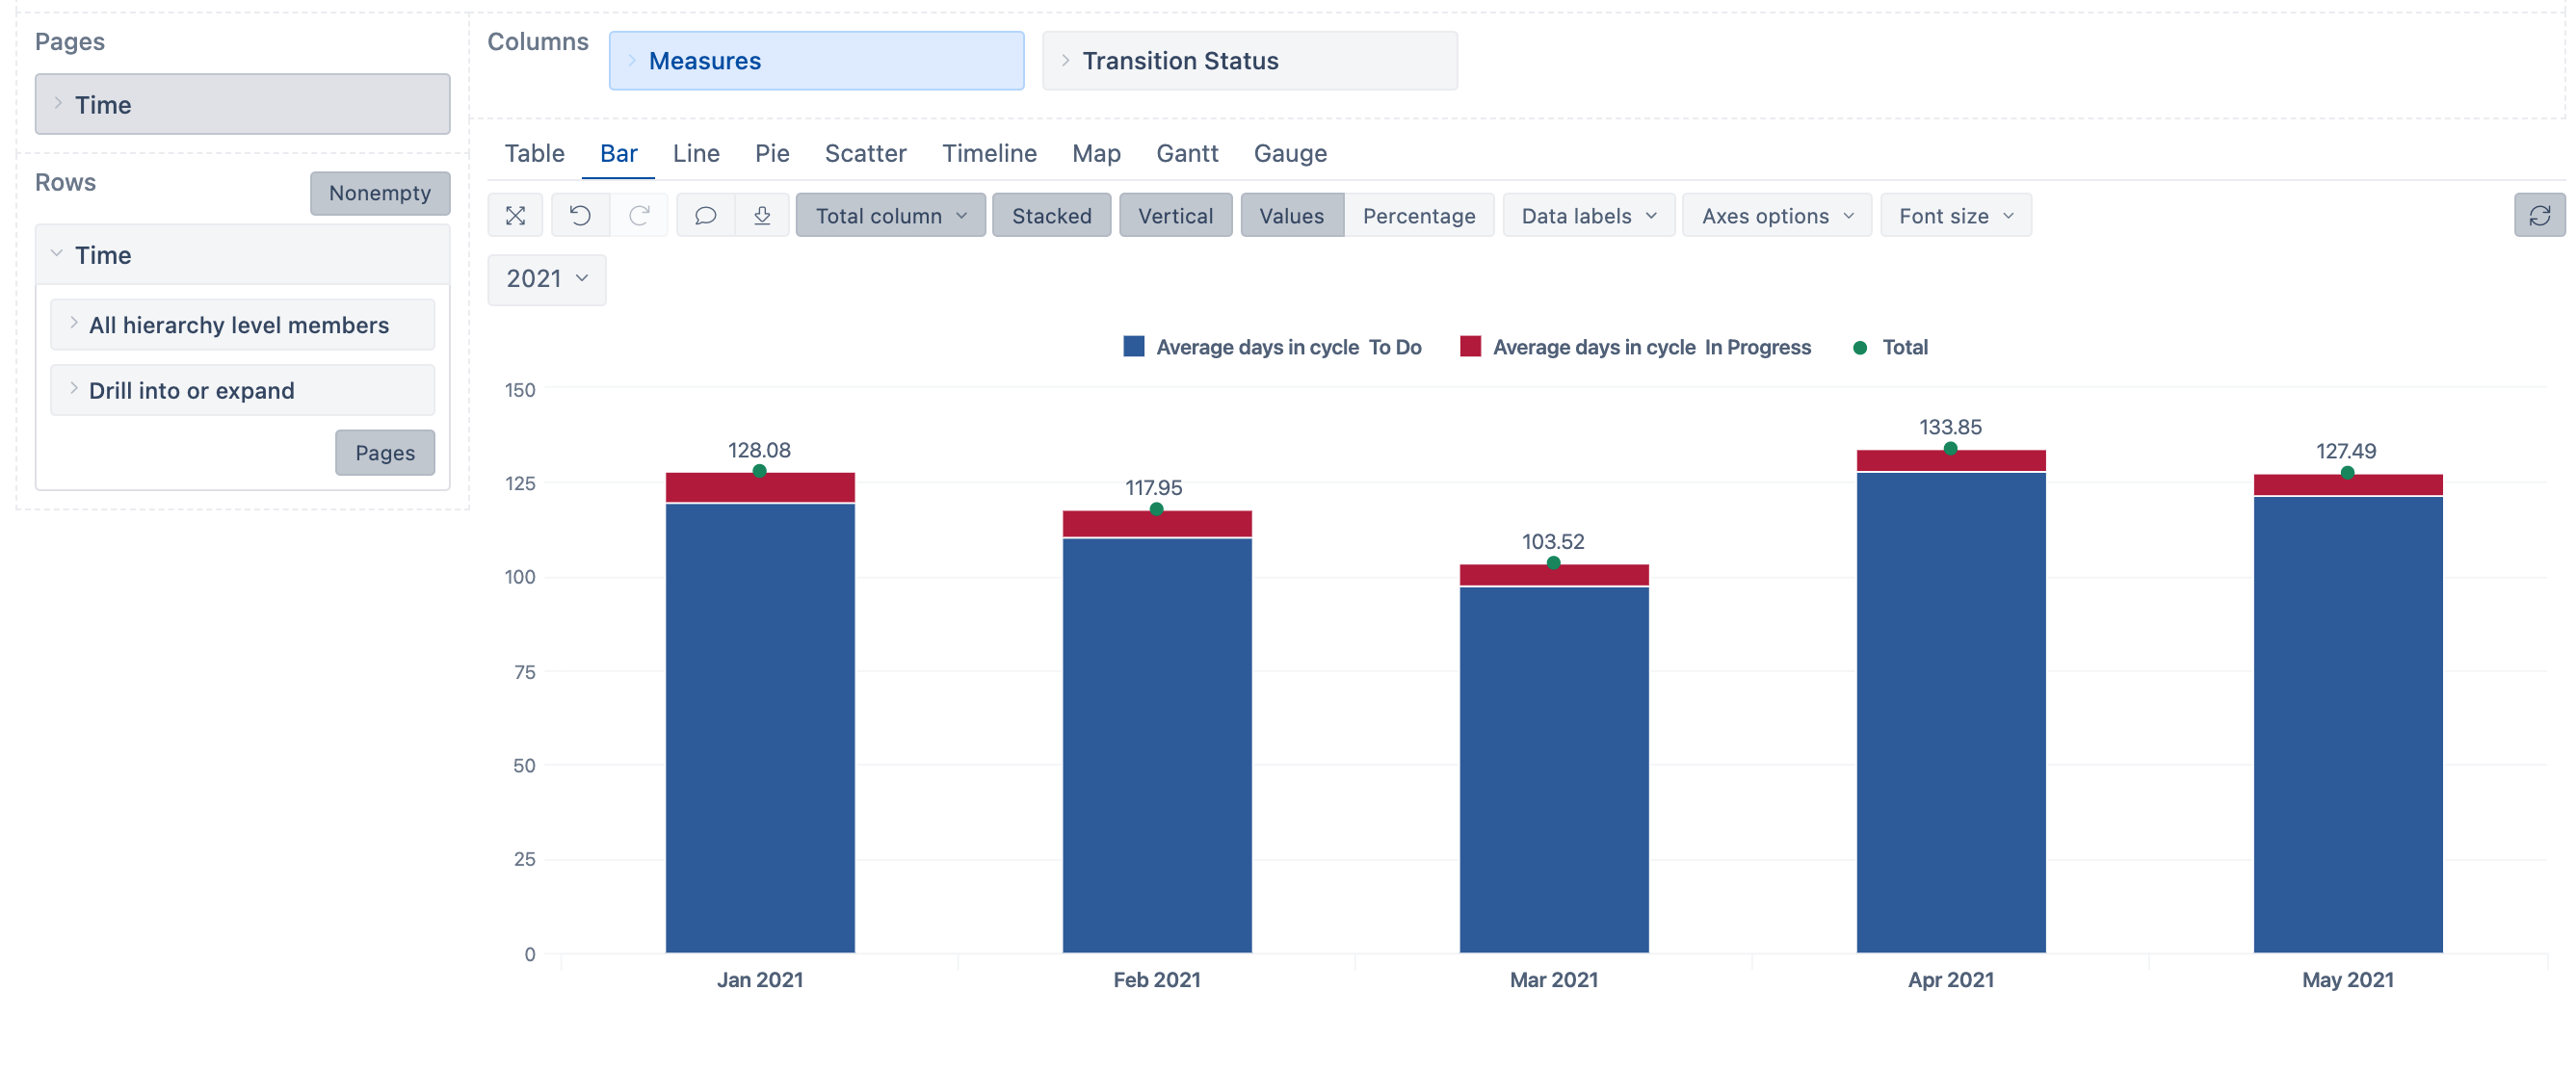
You can use the measure together with the Transition status. Here I used it with category - To do and In progress. I added a Total for columns to see the total average cycle time.
If you have any problems with this. Please try creating a report as far as you can get and then share the report screenshot and the report definition to support@eazyby.com we will check it more in detail.
Daina / support@eazybi.com
Thank you Daina, I have sent my report definition by email.