So, we have multiple stories in projects where each story contains Dev. efforts and QA efforts as sub-tasks. So, i need to represent these sub-tasks status with RAG colors in a separate column based on the difference between the sub-task start date and revised start date incase of any delay with the corresponding sub-task and based on these sub-tasks RAG status colors story and project at hierarchy level need to pick up the RAG color. Is this possible? Can it be represented by any calculated formula??
Hi @Bob1
Welcome to the Community! ![]()
Here’s a calculated formula that could be used for a report like this.
This formula assumes that you have the Issue dimension in Rows, selected in the “Sub-task” hierarchy Parent level.
Create a new measure “RAG colors” with this formula:
CASE WHEN
  [Issue].CurrentHierarchyMember.Level.Name = "Parent"
THEN
  CASE WHEN
    Count(
      Filter(
        ChildrenSet(
          [Issue].CurrentHierarchyMember
        ),
        DateDiffDays(
          [Issue].CurrentHierarchyMember.Get('Start date'),
          [Issue].CurrentHierarchyMember.Get('Revised start date')
        ) > 0
      )
    ) > 0
  THEN
    "RED"
  ELSE
    "GREEN"
  END
WHEN
  [Issue].CurrentHierarchyMember.Level.Name = "Sub-task"
THEN
  CASE WHEN
    DateDiffDays(
      [Issue].CurrentHierarchyMember.Get('Start date'),
      [Issue].CurrentHierarchyMember.Get('Revised start date')
    ) > 0
  THEN
    "RED"
  ELSE
    "GREEN"
  END
END
You can then apply conditional cell formatting to add the color to the necessary measure.
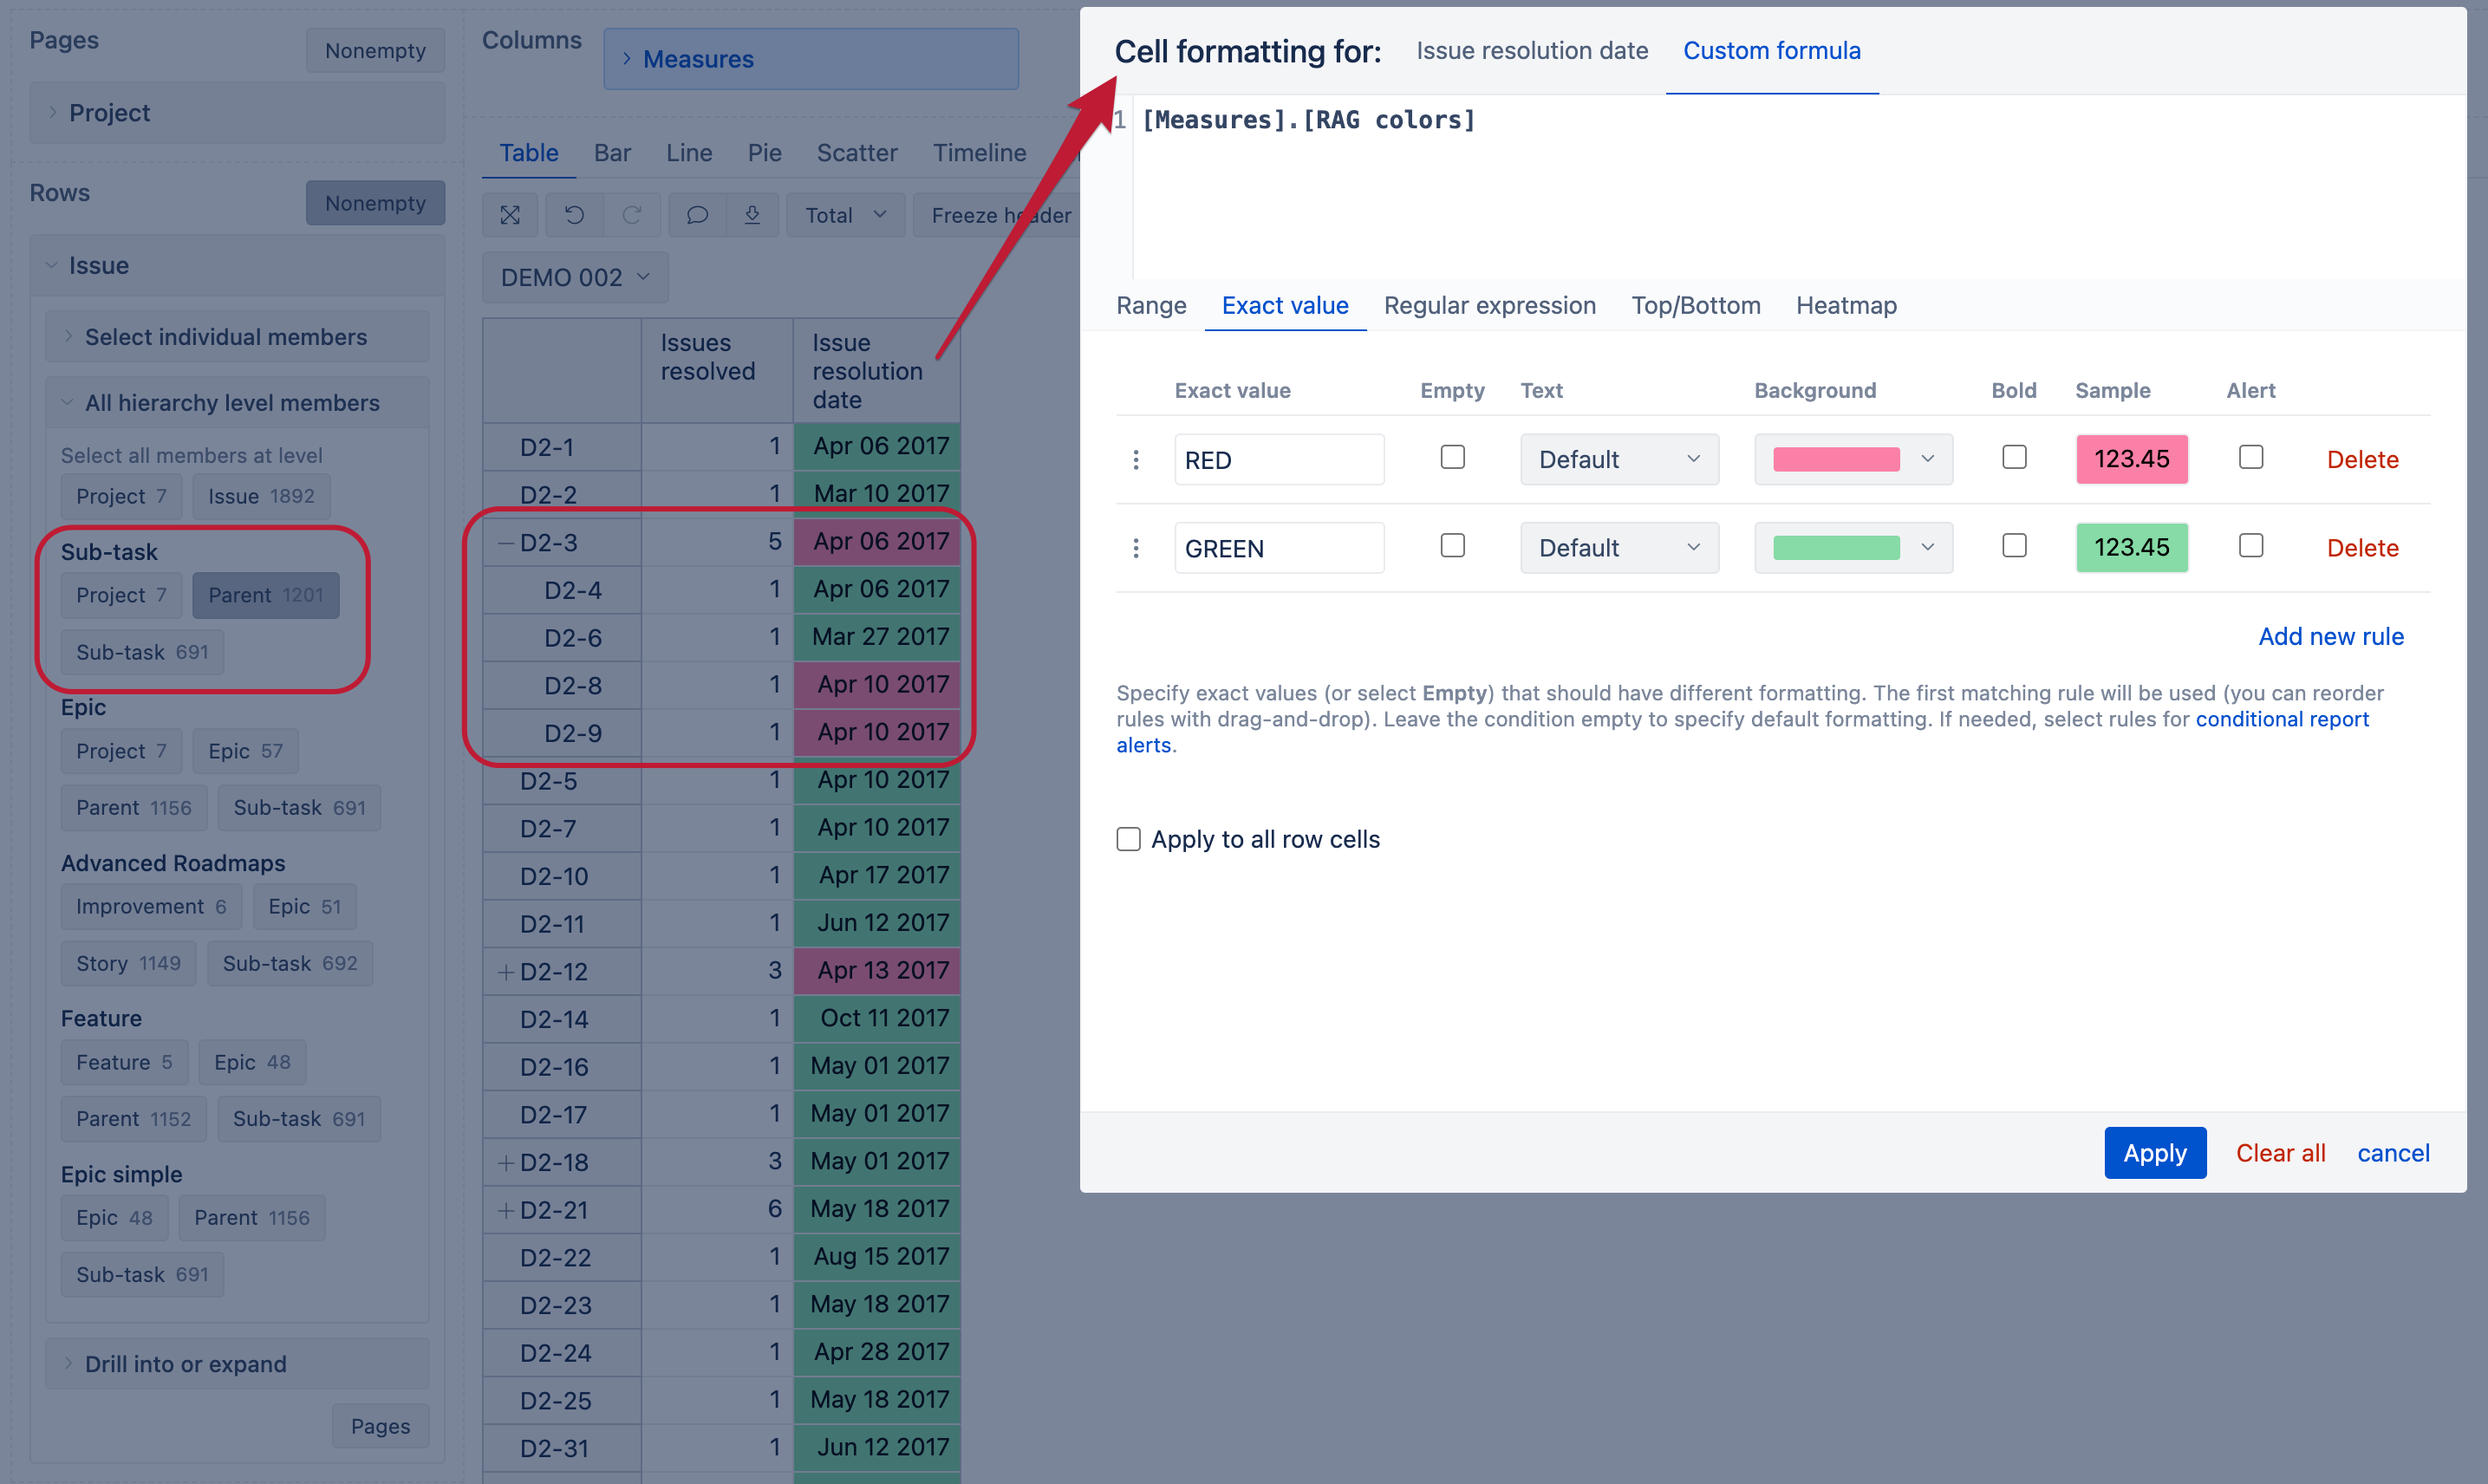
In this example, I compared the resolution date of the Parent issue to the resolution date of the Sub-task. If Sub-task was resolved later than the parent issue, I marked it red.
Let me know if you have any additional questions on this!
Best regards,
Nauris
Thank you very much @nauris.malitis