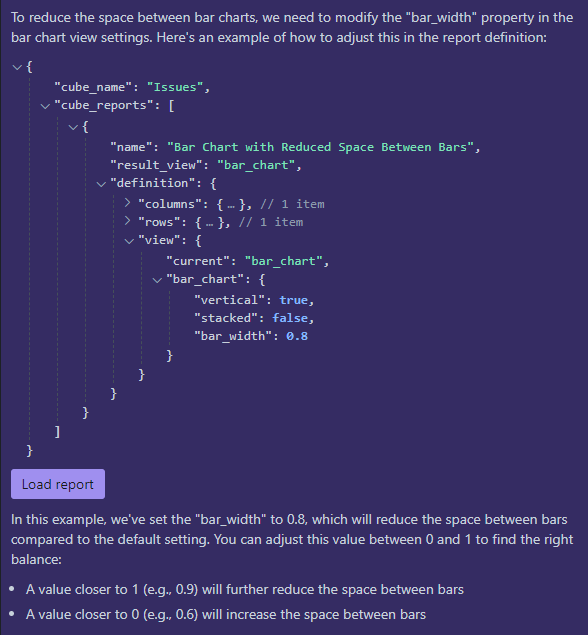
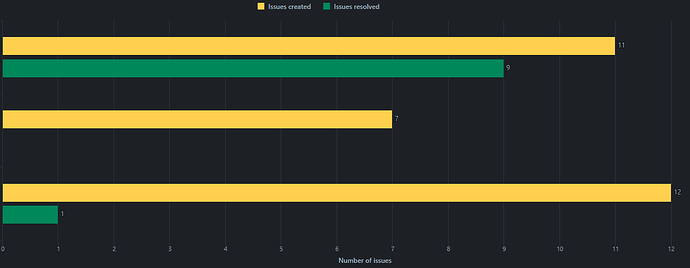
I’ve created a report showing the Epics currently forming our quarterly goals (a simple report, with bar charts showing all issues in that Epic and those completed). The spacing in between the Epics Bar Charts is too large and taking up too much space in the dashboard. According to the Report Builder Assistant, this can be changed by adding “bar_width”: 0.X with a value between 1 and 0. This is changed in the report definition. How do I do that?!
Hi NickLS,
Welcome to the eazyBI community!
Unfortunately, in this case, the assistant’s suggestion is inaccurate.
By default, eazyBI dynamically adjusts the size and layout of the reports depending on the amount of data and screen size. You can only change and fix the report height when editing the dashboard: Create dashboards, but not with extra parameters in reports.
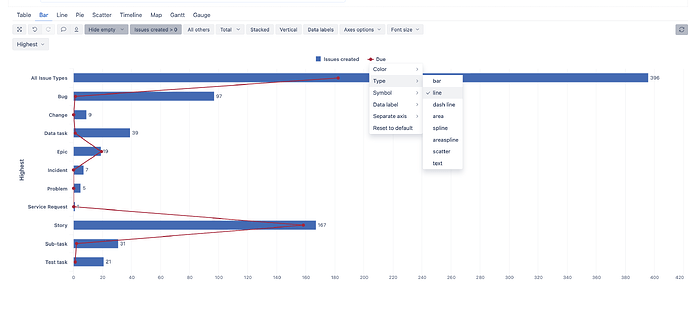
In your example, extra black space in the middle is caused by empty cells in the report column “Issues resolved”. The space in the bar chart is intended to show that data is missing, therefore it can not be reduced if both measures are shown as bars.
You can change one measure type to the line though, to change the visual impact of 0 (or empty) in the chart results, for example:
More about customization options here: Customize chart
Kindly,
Ilze


